
Figures & data
Figure 1. Map of Ghana showing the study area and the land use types (protected areas, fallow area and farmlands) in the Guinea Savanna zone of Northern Ghana.
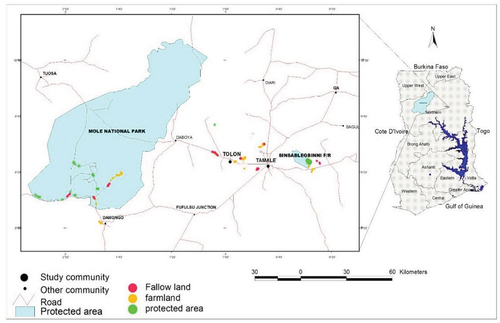
Table 1. Effect of land use type on selected physicochemical properties of soils in three communities in the Guinea Savanna zone of Northern Ghana
Figure 2. Proportion of soil in the selected communities at in the Guinea Savanna Zone of Northern Ghana Error bars represent standard error of means.
Table 2. Effect of soil depth on selected physicochemical properties of soils under three land use types in the Guinea Savanna zone of Northern Ghana
Table 3. Pearson’s product-moment correlation between selected physical and chemical properties in the depth of 0–45 cm under different Land use types in the Guinea Savanna zone of Northern Ghana
Supplemental Material
Download MS Word (543.3 KB)Data availability statement
Data related to the study will be made available by the corresponding author upon request.