Figures & data
Table 1. Below clearly highlights this decline in agricultural engagement and a rise in other sectors within a 4-year period
(Source: Gemma et al., 2013)
Table 2. Below highlights the amount of microplastics that were found in biowaste, energy crops, and agricultural waste after several stages of processing. Overview of plants & compartments. The total number of particles is shown as particles >1 mm per dry weight
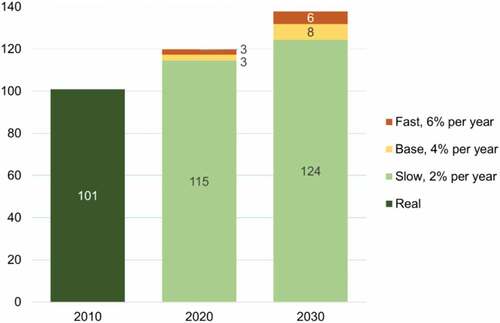
Figure 1. The graph highlighting projections of fertilizer use by 2030.