
Figures & data
Figure 1. Chemical structure of chlorpyrifos.
Figure 2. Six-point calibration curve (10 ppb to 200 ppb (μg/ml)).
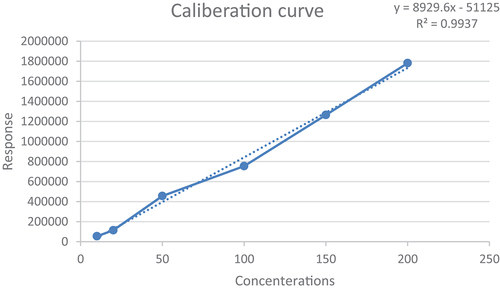
Table 1. Recovery percentage of chlorpyrifos from Golden Delicious apple fruits
Figure 3. Chromatogram of chlorpyrifos: (i) Blank, (ii) standard, and (iii) samples.
Figure 3. (Continued).
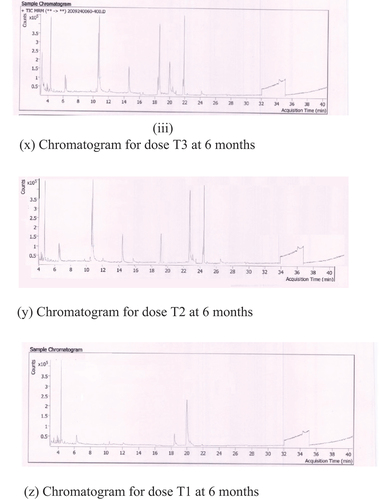
Table 2. Dissipation trend in chlorpyrifos in Golden Delicious apples
Figure 4. (a) Graph of residue dissipation vs. time following first-order kinetics for dose T1. (b) Graph of residue dissipation vs. time following first-order kinetics for dose T2. (c) Graph of residue dissipation vs. time following first-order kinetics for dose T3.
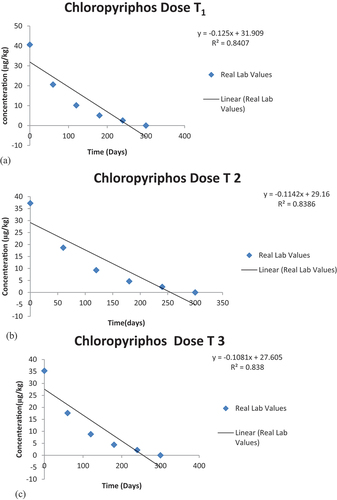
Table 3. Dissipation trend in chlorpyrifos in Golden Delicious apples
Table 4. Dissipation trend in chlorpyrifos in Golden Delicious apples
Table 5. Risk assessment for chlorpyrifos dose T1
Table 6. Risk assessment for chlorpyrifos dose T2
Table 7. Risk assessment for chlorpyrifos dose T3