
Figures & data
Table 1. Demographic characteristics of respondents
Figure 1. A Consumption of fresh ginger (1) (n = 370) and consumer willingness to patronize dried ginger products (2) (n = 259). B Uses of fresh (n = 370) and dried (n = 259) ginger. C Reasons for consuming dried ginger (n = 259). D Consumption pattern of fresh ginger and foods containing ginger (n = 370). Key: Often = 3–6 times in a week. Periodic = once a week
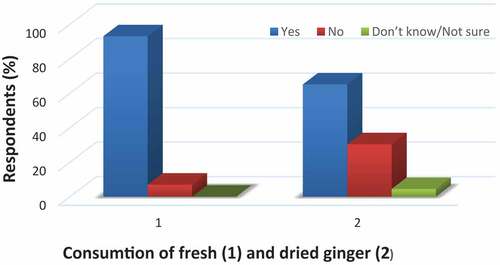
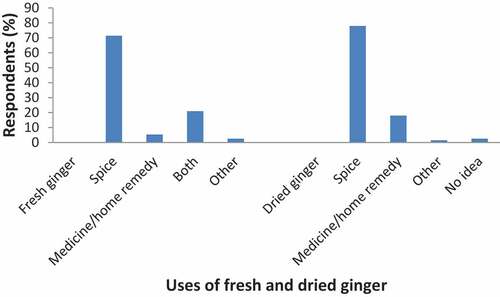
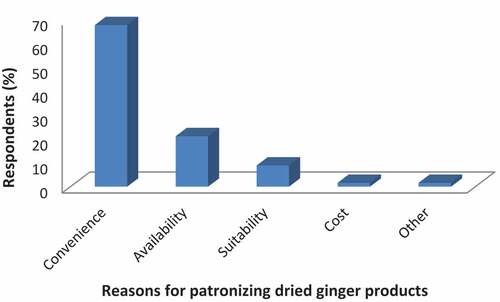
Figure 1. Continued.
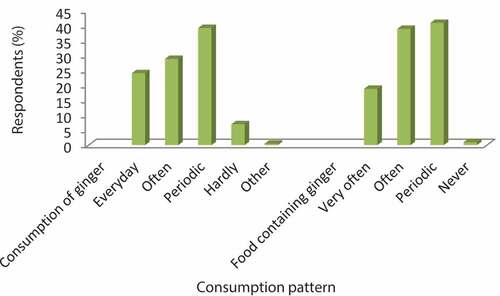
Figure 2. Consumer ranking of the desirable attributes of fresh ginger (n = 370).
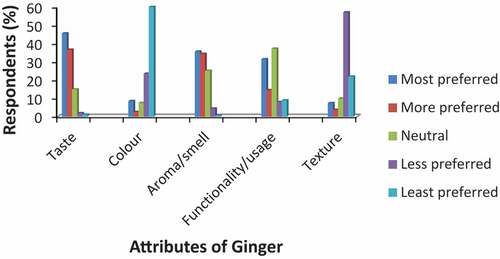
Figure 3. Consumer preferred ginger products (n = 389), ginger sellers’ opinion on consumer preferred ginger products (n = 52) and consumer preferred dried ginger product (n = 259).
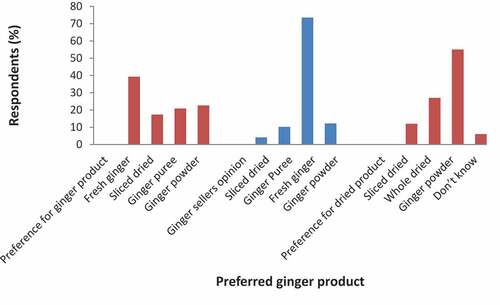
Table 2. Consumer familiarity with dried ginger slices and powder
Figure 4. Consumer quality concerns about the use of dried ginger (n = 189).
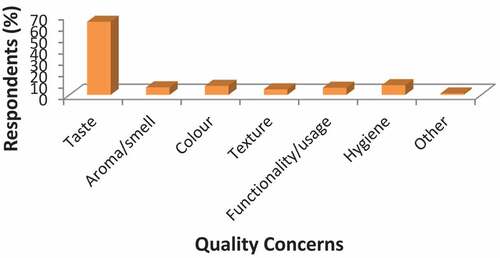
Table 3. Consumer processes to extend shelf life of ginger and preferred source of ginger dried ginger
Figure 5. Availability of ginger all year (1- availability of fresh ginger all year 2- price change with time) (n = 387). B Seasonal price fluctuation of fresh ginger (1 -least priced fresh ginger 2- highest priced fresh ginger) (n = 387).
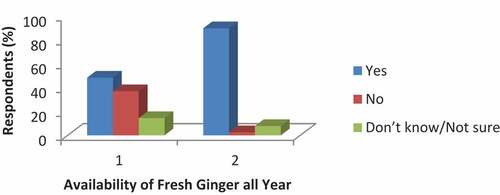
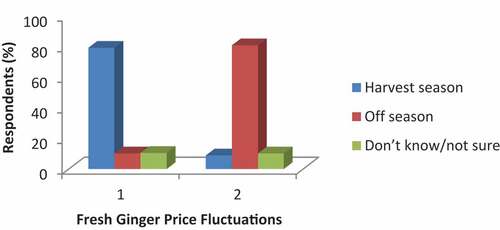
Figure 6. Consumer knowledge of the sicknesses ginger cures (n = 339). B Sicknesses that consumers used ginger to cure (n = 306).
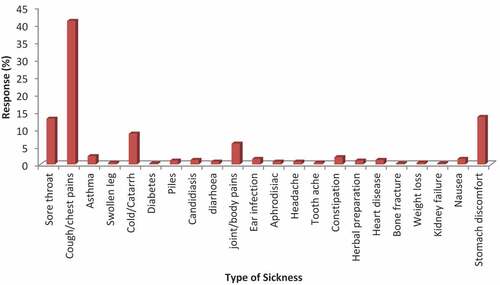
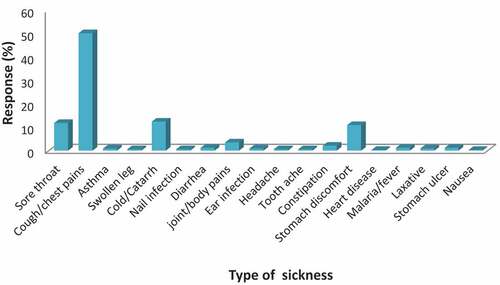
Table A1. Respondent background and preferences of ginger