
Figures & data
Figure 1. Map of the study area
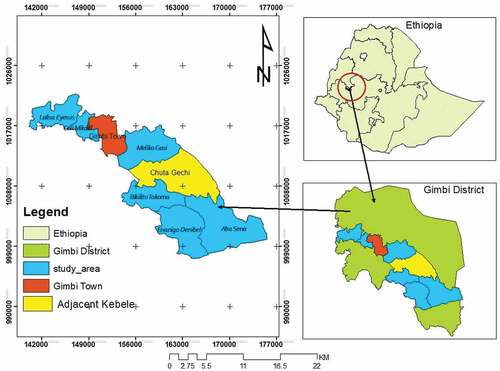
Figure 2. Tree species and coffee-shrub biomass carbon in coffee-based agroforestry systems.
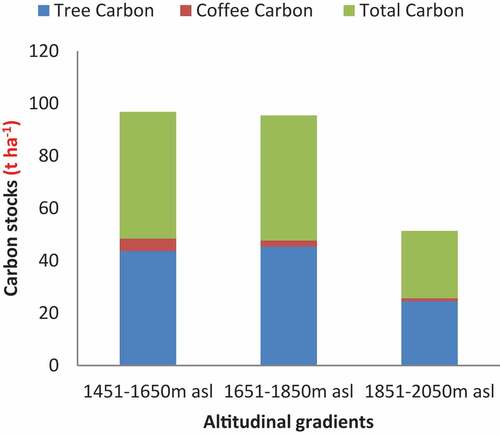
Table 1. Total number of tree families, genera, and species recorded in coffee-based agroforestry
Table 2. Tree diversity indices in coffee-based agroforestry system across altitudinal gradients
Table 3. Tree density and basal area in coffee-based agroforestry systems along different altitudinal gradients
Table 4. Mean (± standard error; n = 20) aboveground and belowground biomass (t ha−1) for each of the three altitudinal gradients and results of one-way ANOVA (at α = 0.05, significant differences between the altitudinal gradient of the biomass carbon stocks)
Figure 3. Tree diversity indices across altitudinal gradient.
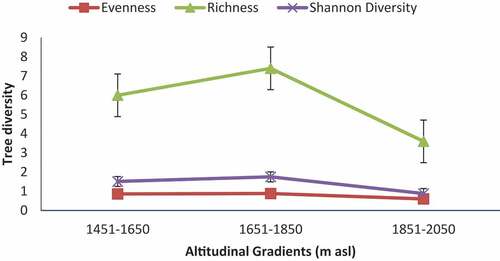
Table A1. Plant species recorded from coffee-based agroforestry system of the study area, Gimbi District, western Ethiopia
Table A2. Value for the different phytosociological parameters measured for different tree species of Coffee-based Agroforestry System in 1451–1650 m asl. altitudinal range
Table A3. Value for the different phytosociological parameters measured for different tree species of Coffee-Based Agroforestry System in 1651–1850 m asl. altitudinal range
Table A4. Value for the different phytosociological parameters measured for different tree species of Coffee-Based Agroforestry System in 1851–2050 m asl. altitudinal range