
Figures & data
Figure 1. A map of mtwara region showing the study districts.
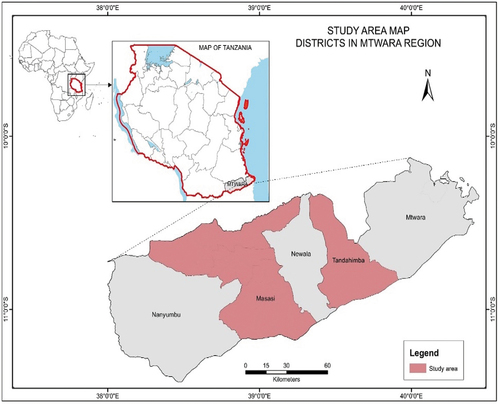
Table 1. Classification of variables in the econometric exploration
Table 2. Cashew growers interviewed in tandahimba and masasi districts (n = 760)
Table 3. Sociodemographic profile of cashew growers in the study districts (n = 760)
Table 4. Cognizance and usage of improved cashew technologies in study districts
Table 5. The espousal intensity of improved cashew technologies in the study districts
Table 6. Main sources of cashew planting materials
Table 7. Factors limiting farmers from using improved technologies
Table 8. The Probit estimates of the factors of espousal of improved cashew technologies
Table 9. Truncated estimated prompting the degree of espousal of cashew technologies
Table A1. Improved cashew varieties released in Tanzania and Yield performance for the first 7 years
Probit, Truncated and Tobit regression estimates for improved planting materials, pesticides application and recommended spacing