
Figures & data
Figure 1. Effect of different concentrations of soybean extract on the mycelial growth of E. salmonicolor (ES) at 5 and 7 days of incubation (28 ± 2°C). Values of percentage inhibition bearing the same letter within the same incubation day are not significantly different at p < 0.05 using Tukey’s post hoc test.
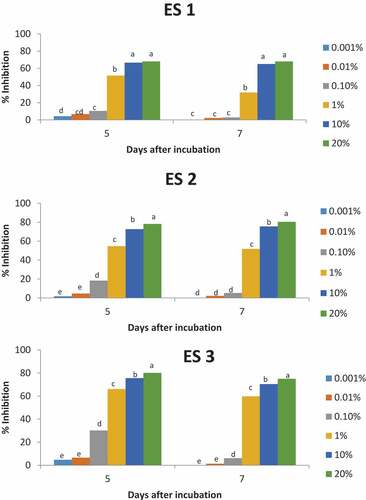
Figure 2. Effect of different concentrations of soybean extract on the mycelial growth of Marasmiellus scandens (MS) isolates at 5 and 7 days of incubation (28 ± 2°C). Values of percentage inhibition bearing the same letter within the same incubation day are not significantly different at p < 0.05 using Tukey’s post hoc test.
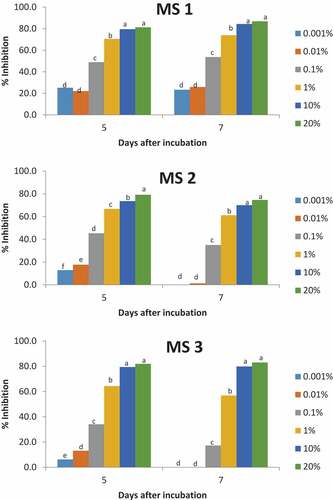
Figure 3. Binary logistic model of soybean extract on the mycelial growth of isolates of Erythricium salmonicolor (ES) after different incubation days. A: ES 1 after 5 days of incubation B: ES 1 after 7 days of incubation C: ES 2 after 5 days of incubation D: ES 2 after 7 days of incubation E: ES 3 after 5 days of incubation F: ES 3 after 7 days of incubation.
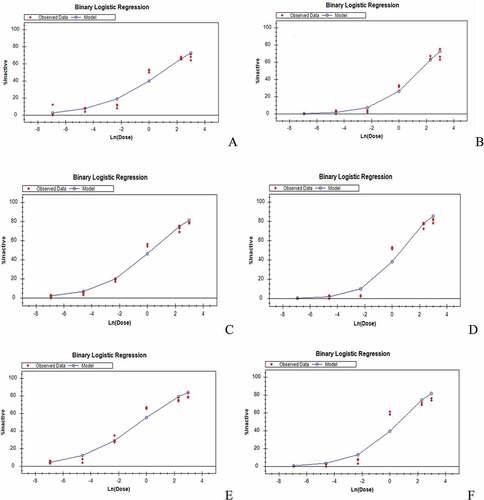
Figure 4. Binary logistic model of soybean extract on the mycelial growth of isolates of Marasmiellus scandens (MS) after different incubation days. A: MS 1 after 5 days of incubation B: MS 1 after 7 days of incubation C: MS 2 after 5 days of incubation D: MS 2 after 7 days of incubation E: MS 3 after 5 days of incubation F: MS 3 after 7 days of incubation.
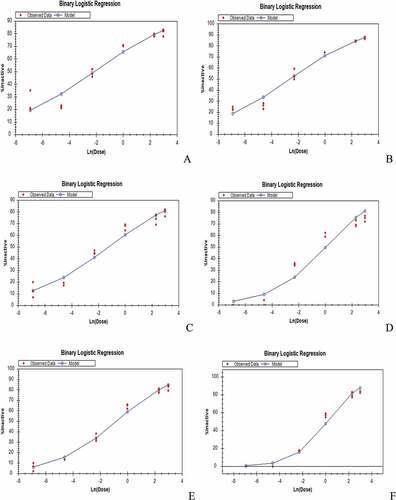
Table 1. Inhibition activity of soybean extract on isolates of Erythricium salmonicolor and Marasmiellus scandens after 5 days of incubation
Table 2. Inhibition activity of soybean extract on isolates of Erythricium salmonicolor and Marasmiellus scandens after 7 days of incubation
Figure 5. Binary logistic model of soybean extract on Microtermes subhyalinus after exposure for 24 hours.
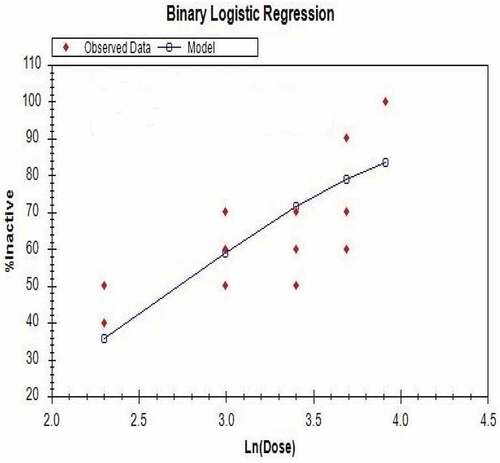
Table 3. Mortality effect of soybean extract on Microtermes subhyalinus after 24 hours of exposure