
Figures & data
Table 1. Summary of related literature
Figure 1. Map of cape coast metropolitan assembly showing study communities.source: centre for remote and geographic information services, 2021.
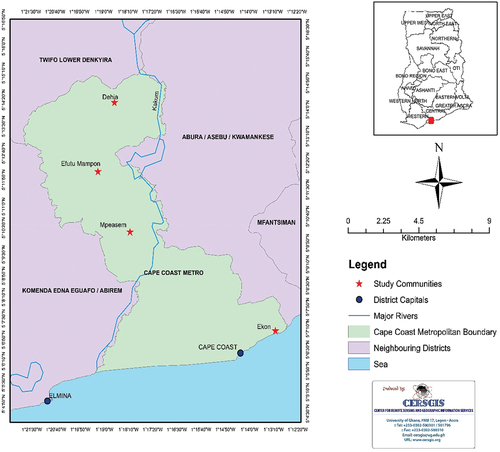
Figure 2. Sampling framework.
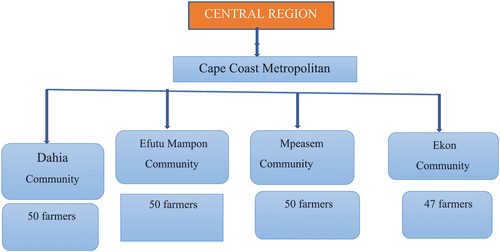
Table 2. Farmers demographic characteristics
Table 3. Summary statistics of continuous variables
Table 4. Summary statistics of climate variables
Figure 3. Rainfall trend in the cape coast metropolis (2009–2018). Source: Ghana meteorological agency (GMeT), 2021.
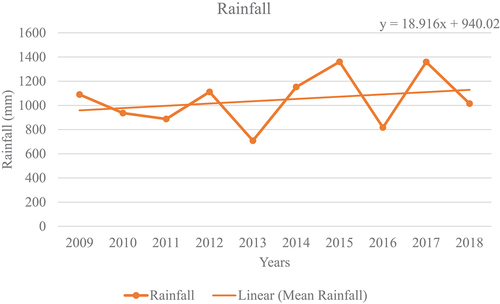
Figure 4. Sunshine trend in the cape coast metropolis (2009–2018). Source: Ghana meteorological agency (GMeT), 2021.
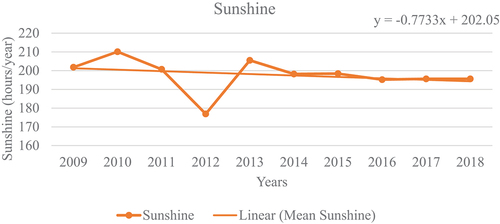
Figure 5. Minimum temperature trend in the Cape Coast Metropolis (2009–2018). Source: Ghana Meteorological Agency (GMeT), 2021.
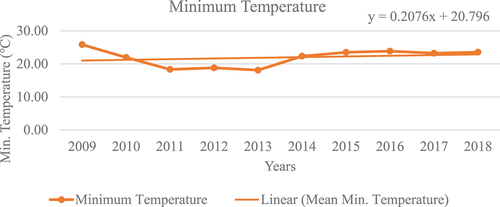
Figure 6. Maximum temperature trend in the Cape Coast Metropolis (2009–2018). Source: Ghana Meteorological Agency (GMeT), 2021.
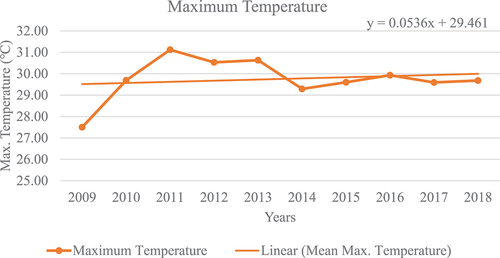
Table 5. Smallholder farmers perception of climate variables