
Figures & data
Table 1. Analysis of variance for cultivar, year, and their interaction for days to 50% flowering, leaf to stem ratio, plant height, dry matter yield, and crude protein yield
Figure 1. The percent plot cover at four weeks (PCFW), and the plot cover at eight weeks (PCEW) of four alfalfa cultivars.
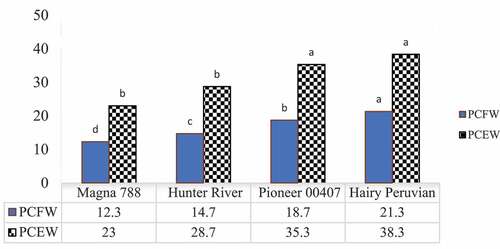
Table 2. Mean values of days to 50% flowering and leaf to stem ratio of four alfalfa cultivars evaluated during 2016 and 2017 years
Table 3. Mean of plant height (PH) at harvest of four alfalfa cultivars evaluated during 2016 and 2017 years at Masha highland
Table 4. Dry matter yield of four alfalfa cultivars during 2016 and 2017 years at Masha highland
Table 5. Crude protein yield of four alfalfa cultivars during 2016 and 2017 years at Masha highland
Table 6. The chemical composition of alfalfa cultivars grown at Masha highland
Data availability statement
The data set used /analyzed during the current study is available from the corresponding author on reasonable request. www.linkedin.com/in/gezahegn-mengistu-ab9492155