
Figures & data
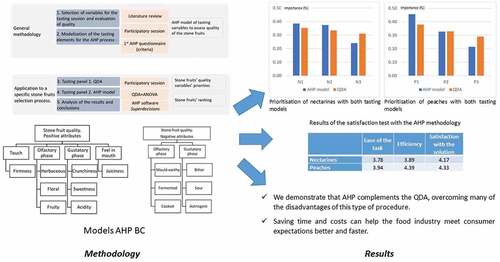
Figure 1. Research methodology.
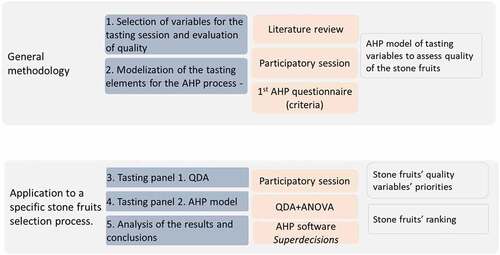
Figure 2. Hierarchy of positive attributes.
Figure 3. Hierarchy of negative attributes.
Figure 4. A. Example of questions each taster received for the first level of attributes.
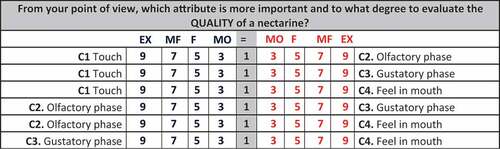
Figure 4. B. Example of questions each taster received for the second level of attributes.
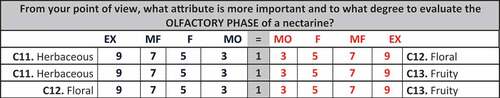
Table 1. Characteristics of the samples of nectarines (N1, N2 and N3) and peaches (P1, P2 and P3) obtained by physicochemical analysis
Table 2. Characteristics of the samples of nectarines (N1, N2 and N3) and peaches (P1, P2 and P3) obtained by sensory analysis
Figure 5. Comparison of first-level positive attributes.
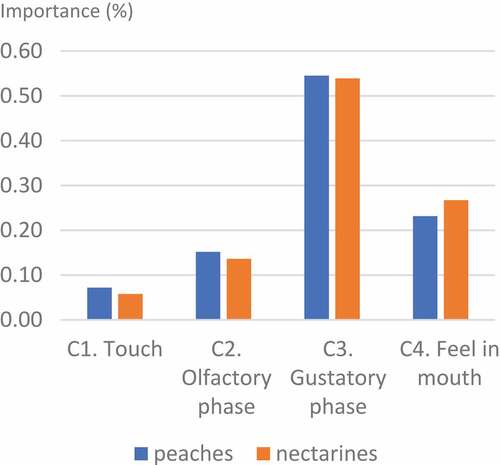
Figure 6. Comparison of second level positive attributes.
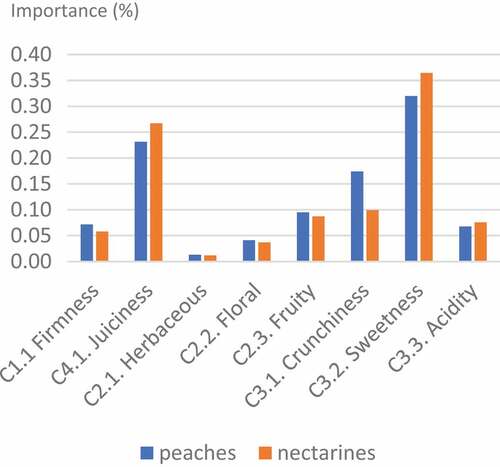
Figure 7. Comparison of first-level negative attributes.
Figure 8. Comparison of second level negative attributes.
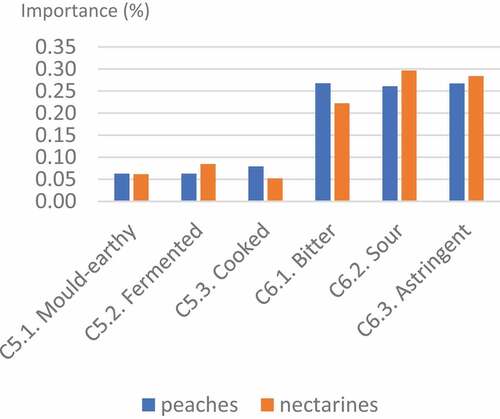
Figure 9. Comparisons among tasting profiles for nectarines.
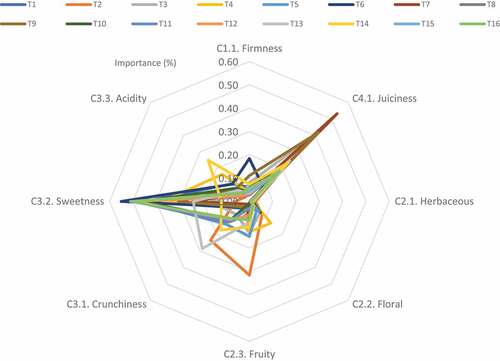
Figure 10. Comparisons among tasting profiles for peaches.
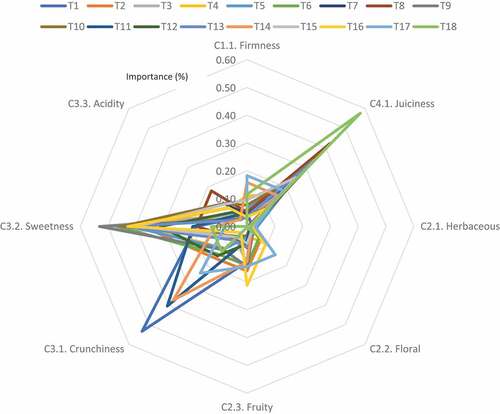
Figure 11. Prioritisation of nectarines with both tasting models.
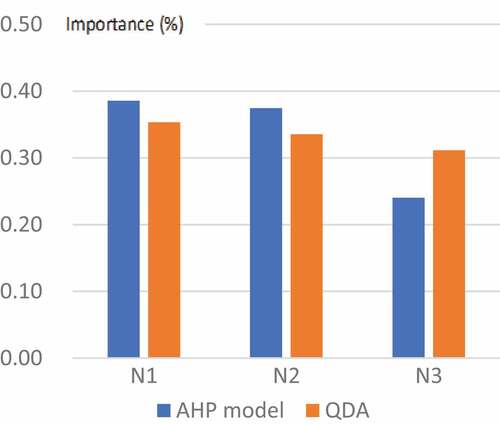
Figure 12. Prioritisation of peaches with both tasting models.
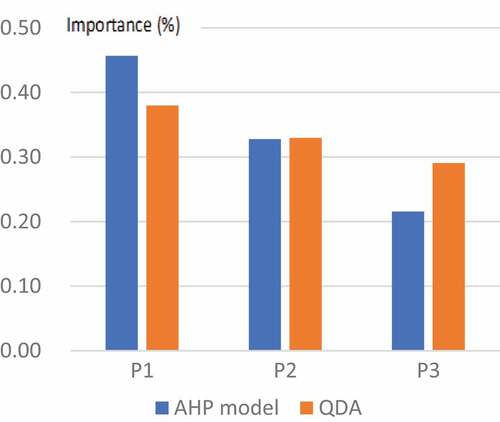
Figure 13. Prioritisation of nectarines according to positive and negative attributes.
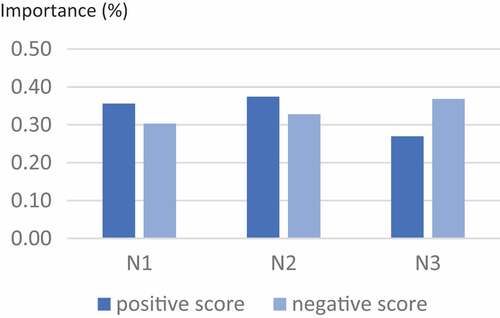
Figure 14. Prioritisation of peaches according to positive and negative attributes.
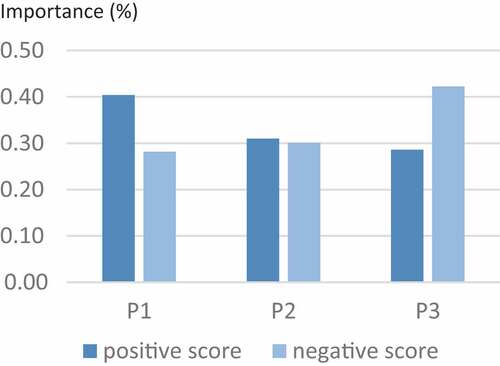
Table 3. Questionnaire on satisfaction of the tasters with the AHP methodology
Table 4. Results of the satisfaction test with the AHP methodology
Data availability statement
The data that support the findings of this study are available from the corresponding author, A.B-P., upon reasonable request.