
Figures & data
Figure 1. Environmental pollution and degradation in Somalia. Data source: World bank, (Citation2022).
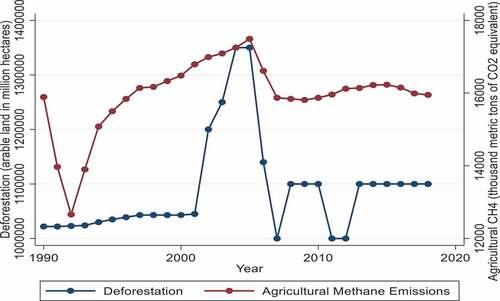
Figure 2. Trends of the interested variables.
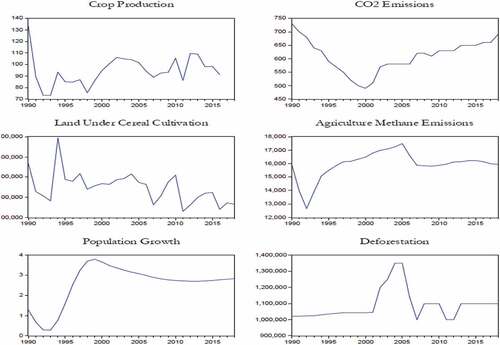
Table 1. Descriptive statistics
Table 2. Result of the ADF and PP unit root tests
Table 3. F-bounds cointegration tests
Table 4. Long-run coefficient elasticities
Table 5. Short-run dynamic effect and diagnostic test
Figure 3. Cusum test.
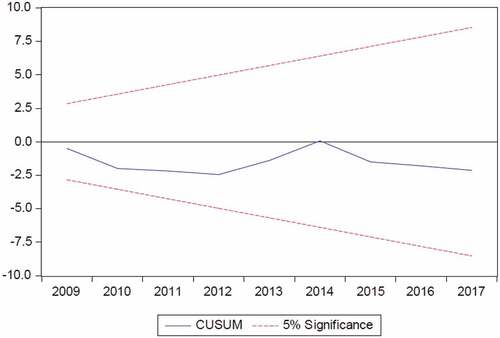
Figure 4. Cusum square test.
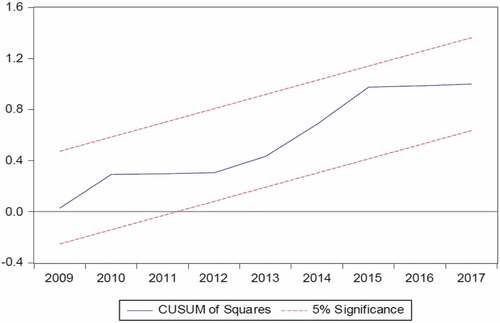
Table 6. Method: Fully modified ordinary least squares (FMOLS)
Table 7. Pairwise granger causality tests
Data availability statement
The datasets used and/or analyzed during the current study are available from the following link:
https://data.worldbank.org/indicator/AG.PRD.CROP.XD?locations=SO
https://www.sesric.org/query.php
https://climateknowledgeportal.worldbank.org/download-data
Compliance with ethical standards