
Figures & data
Table 1. Description of the 11 experimental sites used during 2019 and 2020
Table 2. Description of the 24 maize inbred lines evaluated for agronomic performance across 11 sites during 2019 and 2020 cropping seasons
Table 3. AMMI analysis of variance for 24 normal and biofortified inbred lines across 11 environments
Figure 1. AMMI biplot of Factor 1 and Factor 2 scores for 24 normal and biofortified inbred lines grown across 11 environments.
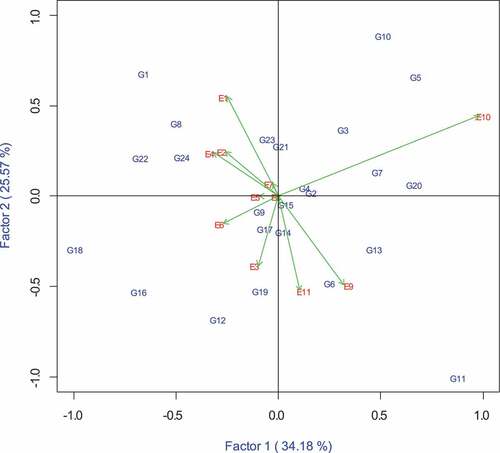
Table 4. Mean grain yield (t ha−1) of 24 normal and biofortified inbred lines evaluated across 11 environments in Zimbabwe
Figure 2. GGE-scatterplot based on environment-focused scaling for environments.
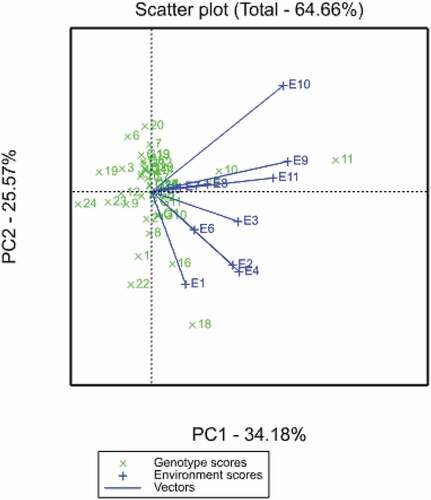
Figure 3. GGE biplot showing which-won-where pattern of the 24 normal and biofortified inbred lines (G) evaluated over across 11 environments.
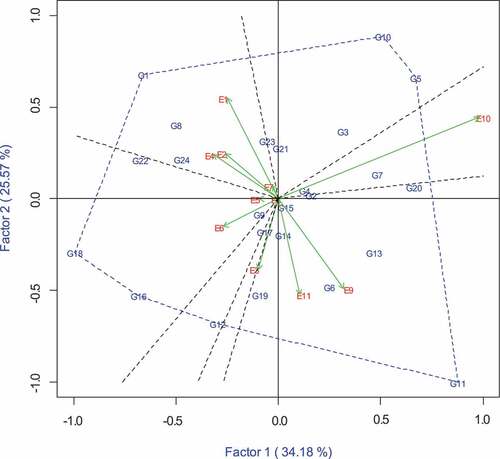
Figure 4. GGE comparison biplot based on genotype-focused scaling for comparing the 24 normal and biofortified inbred lines with the ideal genotype.
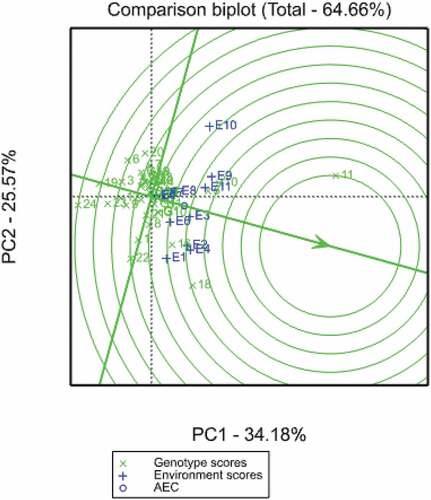
Table 5. Stability analysis of 24 normal and biofortified maize inbred lines evaluated across 11 environments in Zimbabwe
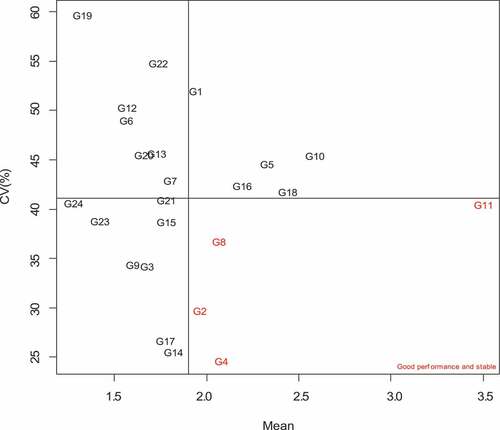
Figure 5. Stability analysis biplot of the 24 normal and biofortified inbred lines (G) evaluated over across 11 environments using the Francis coefficient of determination (CV%).
Data availability statement
All the datasets generated in the current study are available from the corresponding author upon reasonable request.