Figures & data
Figure 1. Layout of experimental site.
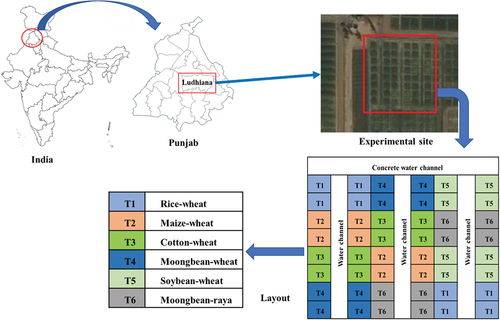
Table 1. Treatment details and management practices of individual crops grown under different cropping systems
Figure 2. Surface and depth-wise distribution (up to 120 cm) of soil pH, EC, OC, available P and K, DTPA-Zn, Fe, Mn, Cu, Ni and B, soluble Ca and Mg and available S under different cropping systems.
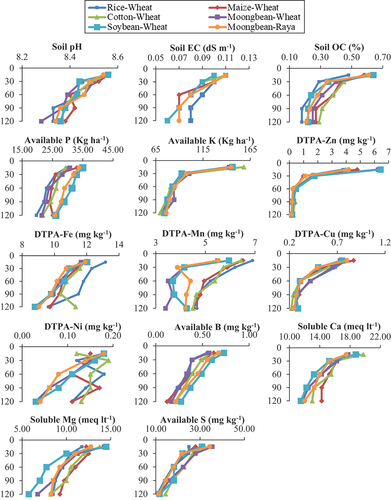
Table 2. Variation of soil OC and available macronutrients in soil profile (mean values of 0–15, 15–30, 30–60, 60–90, and 90–120 cm) under different cropping systems
Table 3. Variation of soil micro nutrients in soil profile (mean values of 0–15, 15–30, 30–60, 60–90, and 90–120 cm) under different cropping systems
Table 4. Variation of soil secondary nutrients in soil profile (mean values of 0–15, 15–30, 30–60, 60–90, and 90–120 cm) under different cropping systems
Table 5. Correlation analysis of soil parameters
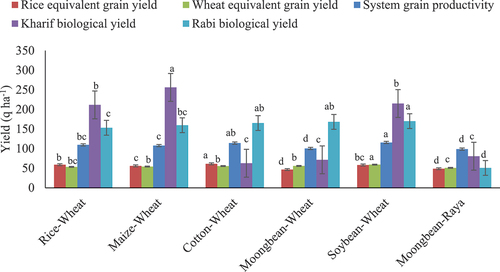
Figure 3. Effect of different cropping systems on rice equivalent grain yield (q ha−1), wheat equivalent grain yield (q ha−1), system grain (wheat equivalent) productivity (q ha−1), and biological yield (q ha−1) of kharif and rabi season crops.