Figures & data
Table 1. Fertilizer mixtures
Figure 1. The length of buds of different tea varieties under organic (T1) and inorganic treatments (T2).
Figure 2. The breadth and weight of buds of different tea varieties under organic (T1) and inorganic treatments (T2).
Table 2. T test for the physical properties of tea plant with organic and inorganic treatments
Figure 3. The length, breadth and weight of first leaf of different tea varieties under organic (T1) and inorganic treatments (T2).
Figure 4. Caffeine (%) content of different varieties of (a) fresh leaves and (b) black tea under organic (T1) and inorganic treatments (T2).
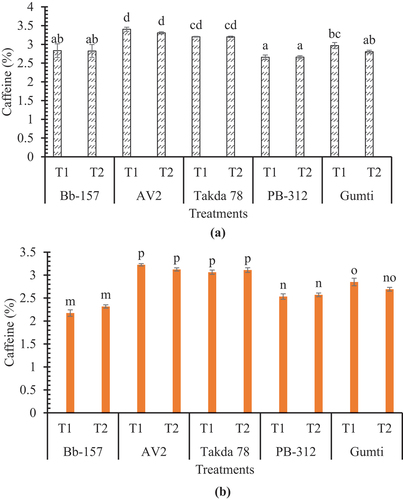
Table 3. T test for the chemical properties of tea leaves and its black tea with organic and inorganic treatments
Figure 5. TPC (mg GAE/g dry extract) of different varieties of (a) fresh leaves and (b) black tea under organic (T1) and inorganic treatments (T2).
Figure 6. TFC (mg QE/g dry extract) of different varieties of (a) fresh leaves and (b) black tea under organic (T1) and inorganic treatments (T2).
Figure 7. % DPPH scavenging activity of different varieties of (a) fresh leaves and (b) black tea under organic (T1) and inorganic treatments (T2).
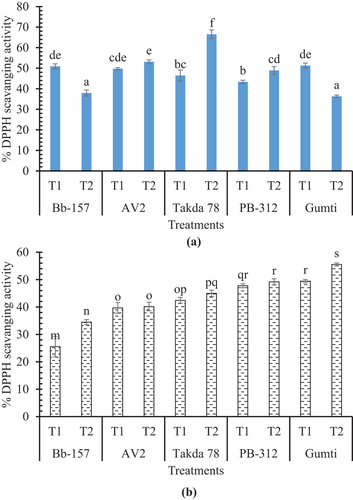
Figure 8. Correlation plot between TFC, TPC, % DPPH scavenging activity, and caffeine content of black tea.
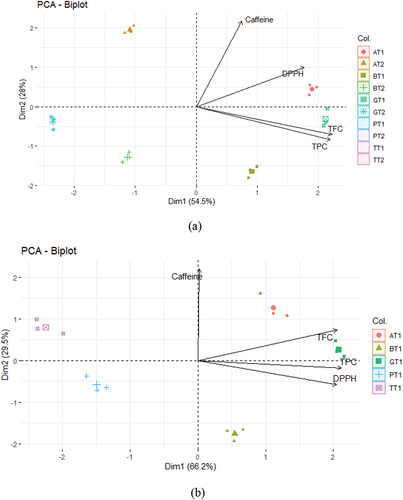
Figure 9. Bi-plot distributions of different samples with grouping TFC, TPC, % DPPH scavenging activity, and caffeine content (a) black tea under organic and inorganic treatments (b) black tea under organic treatment only. Here, A, B, G, P, and T denote AV2, Bb-157, Gumti, PB-312, and Takda 78, respectively, while T1 and T2 denote organic and inorganic, respectively.