
Figures & data
Figure 1. A schematic diagram showing the relationship between predictor variables and household food in/security.
Source: Adapted from (Birhane et al., Citation2014; Berlie, Citation2020)
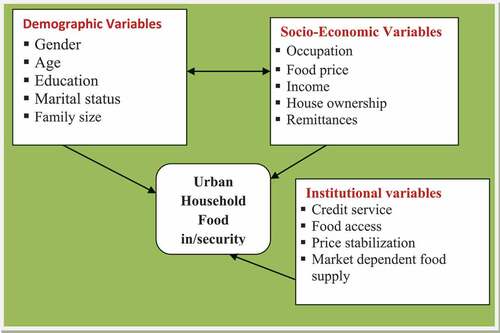
Table 1. Summary Table of Sample kebeles and Households
Table 2. The expected sign of the explanatory variables
Figure 2. Map of Bahir Dar & Gondar city, Ethio-GIS.
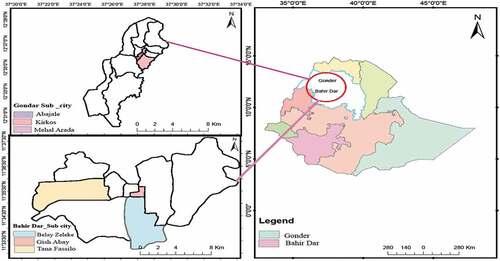
Table 3. Demographic Characteristics and kilocalorie intake of households per adult equivalent per day
Table 4. Socio-economic & institutional variables and Kilocalorie consumption/A.E./day
Table 5. FGT: Food Insecurity Index Result
Table 6. Comparison of FGT between sample cities
Table 7. Binary logistic regression results