
Figures & data
Figure 1. District map of Ho Municipal showing the sampling sites. Source: 2010 population and housing census, District analytical report, (Ho Municipality) (Ghana Statistical Service GSS, Citation2010).
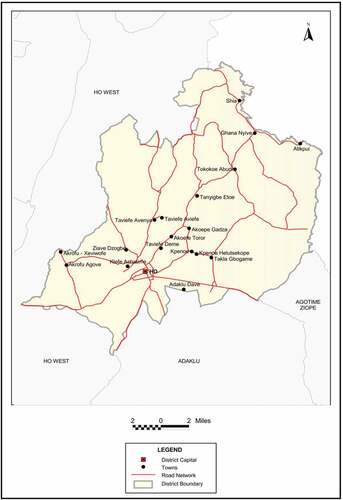
Table 1. Mean concentration levels (mg/kg) of OCPs residue of selected vegetables. Values are means of 3 replicates (n = 3) with standard errors (±SE). Values showing the same letters indicate no significant differences in the vegetables within same OCPs residue at p ≤ 0.01
Table 2. The level of OCPs mean concentrations (mg/kg) of vegetables selected from different markets in Ho Municipal. Values are means of 4 replicates (n = 4) with standard errors (±SE). Values showing the same letters indicate no significant differences in the market within same OCPs residue at p ≤ 0.01
Table 3. Interaction effect of market and vegetable type on the mean concentration levels (mg/kg) of OCPs residue. Values are means of 3 biological replicates (n = 3) with standard errors (±SE). Values showing the same letters indicate no significant differences in the interaction between vegetables and market within same OCPs residue at p ≤ 0.01
Table 4. Mean concentration (mg/kg) of OCP residues in the present study compared with other studies
Table 5. Health risk estimation for OCP residues detected in vegetables from Ho Municipal
Data Availability Statement
Derived data supporting the outcomes of this research are available from the corresponding author [J.A] when requested.