
Figures & data
Figure 1. Map of the study area.
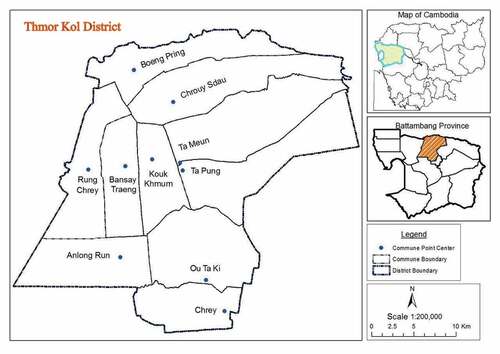
Table 1. Proportionate sampling of rice farm households
Table 2. Description of the independent variables in quantitative analysis for volume of rice sale
Table 3. Description of the dependent and independent variables in quantitative analysis for profitability of rice farming
Table 4. Variance inflation factor (VIF) for the set of covariates included in both of the regression analyses
Figure 2. Distribution of farmers by landholding size in the study area.
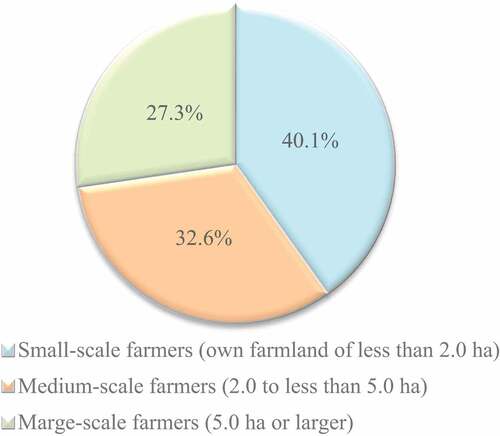
Table 5. Distribution of landholding size in the study area
Table 6. Profile of the sampled rice farmers: distribution of socioeconomic variables by landholding category
Figure 3. Proportion of different uses of rice harvest in the study area.
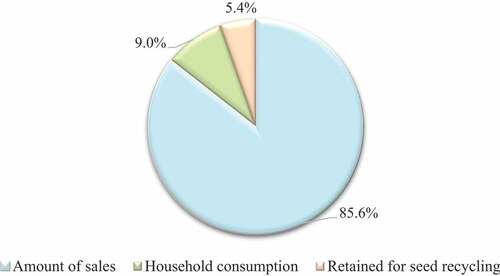
Table 7. Quantity of production, sale, household consumption, and seed recycling (tonne)
Table 8. Yield (tonne/ha) of three groups of rice farmers
Table 9. Access to irrigation facilities, road condition, access to market, access to extension service, and access to credit
Table 10. Price and revenue of rice of three group farmers
Table 11. Seed and fertilizer costs per area for three size groups of rice farmers
Table 12. Transportation cost and distance to market of three groups of rice farmers
Table 13. Profitability of rice production for three size groups of farmers
Table 14. Average cost and profit of paddy production per ha in Battambang Province
Figure 4. Frequency distribution of paddy sale.
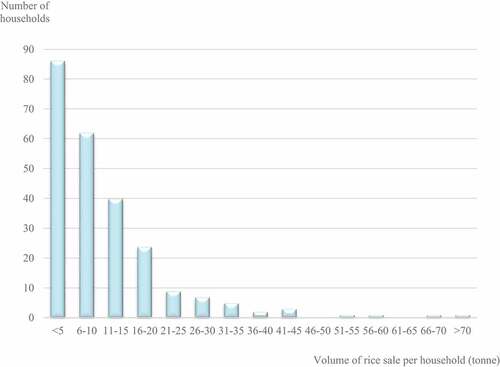
Figure 5. Frequency distribution of natural logarithm of paddy sale.
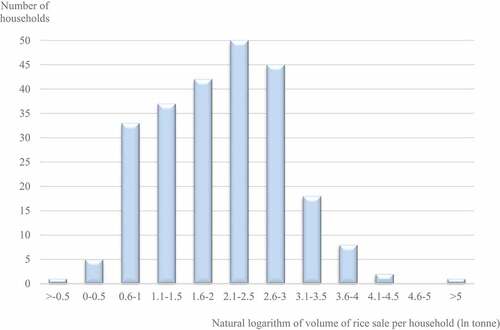
Figure 6. Frequency distribution of profitability of paddy production.
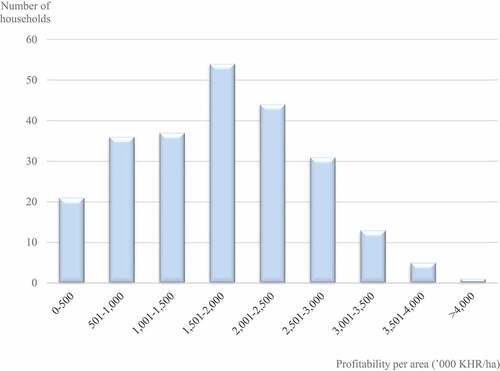
Table 15. Log-linear ordinary least squares regression for volume of rice sale
Table 16. Ordinary least squares regression for profitability of rice farming