Figures & data
Table 1. Experiment design
Table 2. Disease index (DI) of screw pepper under different ZNC concentrations
Figure 1. Scanned image of pepper root system under different treatments. Control (a), ZNC5 (b), ZNC20 (c), Rs (d), ZNC5+Rs (e), ZNC20+Rs (f).
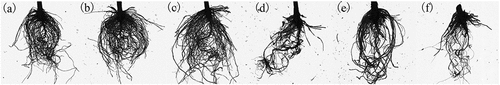
Table 3. Plant height, stem diameter, total biomass, dry matter yield and root/shoot ratio of pepper under different treatments
Table 4. Root morphology of pepper under different treatments
Figure 2. Chlorophyll content under different treatments. Data are shown as the mean ± SD (n = 6). The results of two-way ANOVA was shown in the upper left corner of the figure: “Rs” represents the effect of Rs inoculation; “ZNC” represents the effect of ZNC concentration; “Rs*znc” represents the interaction effect of Rs inoculation and ZNC concentration. Different letters above the bars indicate significant differences among treatments (P < 0.05).
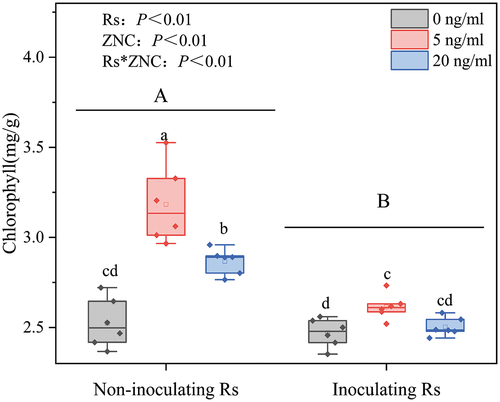
Table 5. Photosynthetic parameters of pepper under different treatments
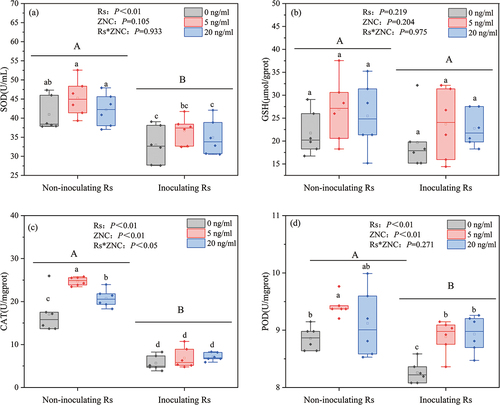
Figure 3. SOD activity (a), GSH content (b), CAT activity (c) and POD activity (d) under different treatments. Data are shown as the mean ± SD (n = 6). The results of two-way ANOVA was shown in the upper left corner of the figure: “Rs” represents the effect of Rs inoculation; “ZNC” represents the effect of ZNC concentration; “Rs*znc” represents the interaction effect of Rs inoculation and ZNC concentration. Different letters above the bars indicate significant differences among treatments at P < 0.05.