
Figures & data
Figure 1. Graphical abstract.
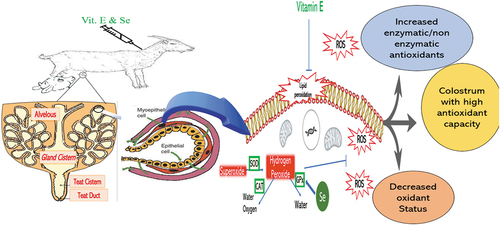
Figure 2. The influence of late gestation vitamin E and selenium injection on different enzyme activities such as SOD [A] Catalase [B] and POD [C] in colostrum. Results are expressed as Mean value ± Standard error along with data points having different letters are significantly different at P<0.01.
![Figure 2. The influence of late gestation vitamin E and selenium injection on different enzyme activities such as SOD [A] Catalase [B] and POD [C] in colostrum. Results are expressed as Mean value ± Standard error along with data points having different letters are significantly different at P<0.01.](/cms/asset/22dda19b-2e54-4324-a157-1f65311dcf9b/oafa_a_2197711_f0002_oc.jpg)
Table 1. SOD, catalase, and POD activity in colostrum. Results are presented as Mean ± Standard error and different alphabets are statistically significantly different at P < 0.01
Figure 3. The influence of late gestation vitamin E and selenium injection on total flavonoids content [A] and ascorbic acid [B] level in colostrum. Results are expressed as Mean value ± Standard error along with data points having different letters are significantly different at P<0.01.
![Figure 3. The influence of late gestation vitamin E and selenium injection on total flavonoids content [A] and ascorbic acid [B] level in colostrum. Results are expressed as Mean value ± Standard error along with data points having different letters are significantly different at P<0.01.](/cms/asset/b7457ad5-0054-422d-945f-9f4d1571f9a7/oafa_a_2197711_f0003_oc.jpg)
Table 2. Total flavonoid content and ascorbic acid activity in colostrum. Results are presented as Mean ± Standard error and different alphabets are statistically significantly different at P < 0.01
Figure 4. The influence of late gestation vitamin E and selenium injection on esterase enzyme activity in colostrum. Results are expressed as Mean value ± Standard error along with data points having different letters are significantly different at P<0.01.
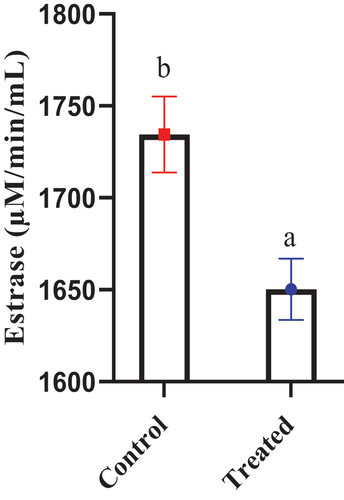
Table 3. Esterase activity in colostrum. Results are presented as Mean ± Standard error and with different alphabets are statistically significantly different at P < 0.01
Figure 5. The influence of late gestation vitamin E and selenium injection on TSP [A] TOS [B] TAC [C] MDA [D] level in colostrum. Results are expressed as Mean value ± Standard error along with data points having different letters are significantly different at P<0.01.
![Figure 5. The influence of late gestation vitamin E and selenium injection on TSP [A] TOS [B] TAC [C] MDA [D] level in colostrum. Results are expressed as Mean value ± Standard error along with data points having different letters are significantly different at P<0.01.](/cms/asset/a01746f7-90a1-405e-b5d1-4e512ca81466/oafa_a_2197711_f0005_oc.jpg)
Table 4. TSP, TOS, TAC, and MDA level in colostrum. Results are presented as Mean ± Standard error and different alphabets are statistically significantly different at P < 0.01