Figures & data
Figure 1. Three-axis dimensions of wheat.
Figure 2. Triaxial normal distribution of wheat.
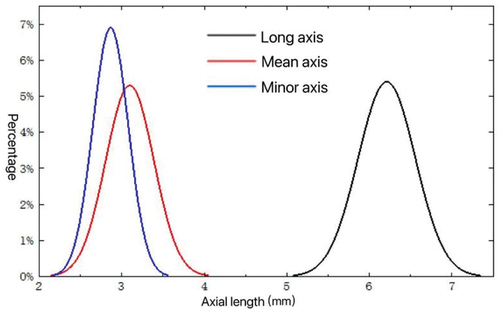
Table 1. Results of statistical analysis of wheat
Figure 3. Schematic diagram of the pneumatic cyclone transmission experimental system of the bulk grain pipeline.
Figure 4. Cyclone simulation pipeline.
Figure 5. Spinning devices of different sizes.
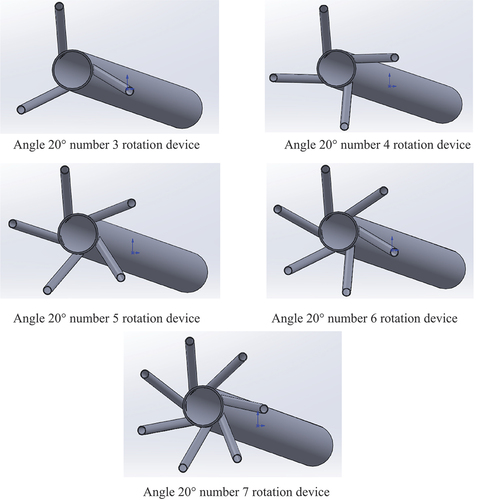
Table 2. Simulation and simulation parameters
Figure 6. Axial velocity of tracheal filling number 3–7 at different angles.
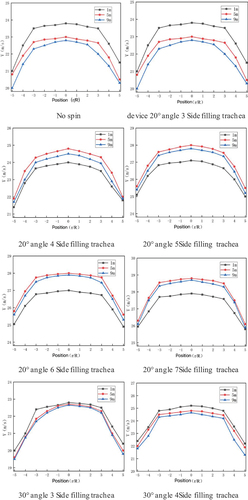
Figure 6. (Continued).
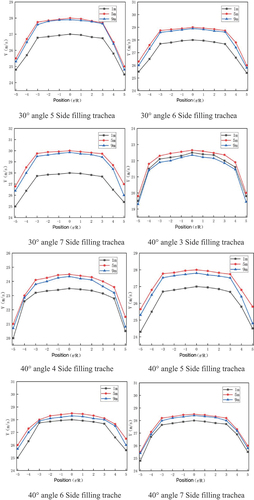
Figure 7. Tangential velocity of tracheal filling number 3–7 under different angles.
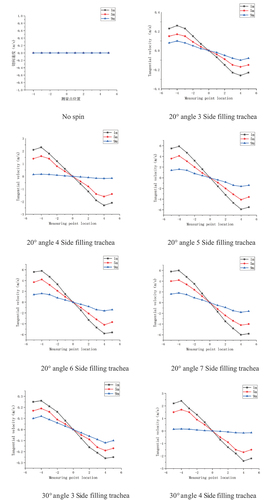
Figure 7. (Continued).
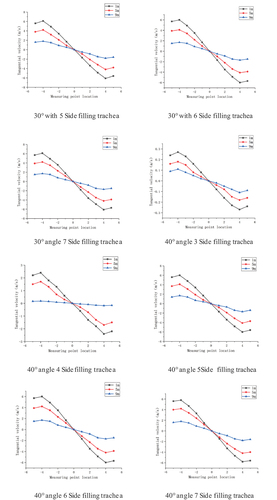
Figure 8. Tracks of flow field movement at number of side trachea at t = 1s.
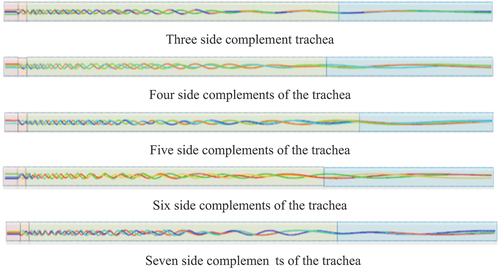
Figure 9. Static pressure at the measurement point.
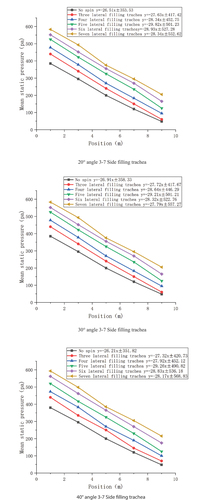
Figure 10. Static pressure drop of different device.
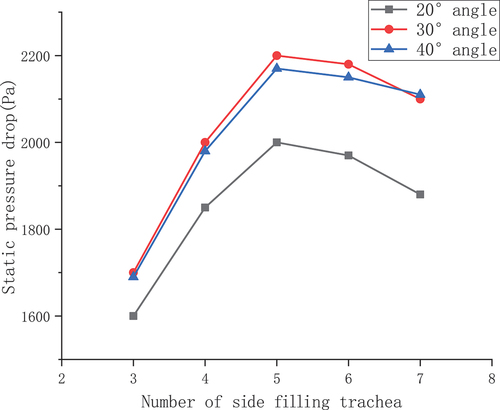
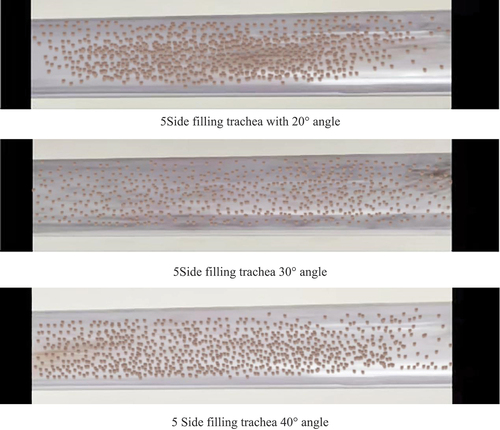
Figure 11. Polyphase flow trace diagram at different angles.
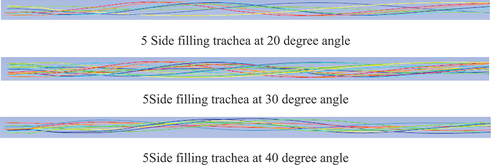
Figure 12. 3D Printing a starting device with different angles.
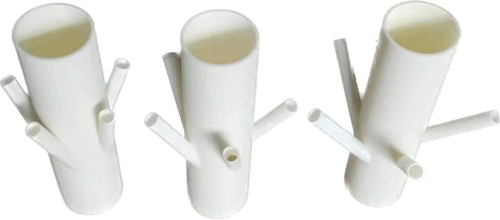
Figure 13. Experimental setup Fig.
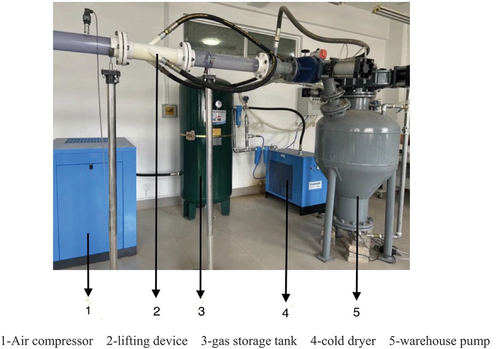
Figure 14. Test results of different clip angles.