
Figures & data
Figure 1. Changes in agricultural GDP across the three countries since 2000.
Source: World Bank Indicators (2015)
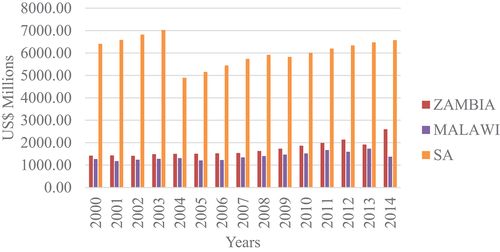
Figure 2. Changes in private investment across the three countries since 2000.
Source: World Bank Indicators (2015)
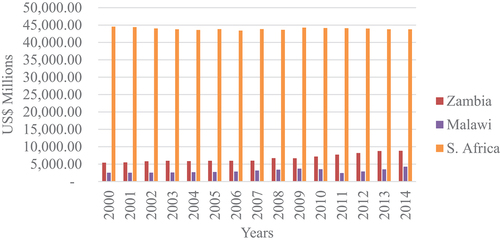
Figure 3. Changes in net trade across the three countries since 2000.
Source: ITC (Citation2015), calculations based on UN COMTRADE statistics.
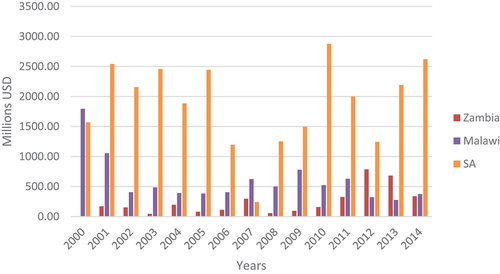
Figure 4. Zambia % shares of agricultural expenditure types.
Source: Compiled from various published budget statements obtained from the Ministry of Finance and National Assembly.
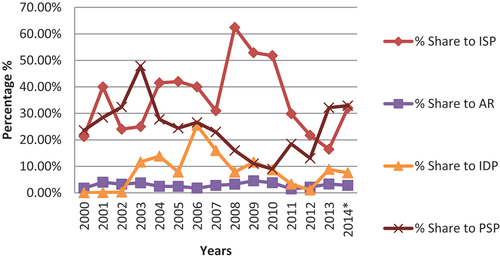
Figure 5. Malawi % shares of agricultural expenditure types.
Source: Compiled from various budget statements obtained from the Ministry of Finance
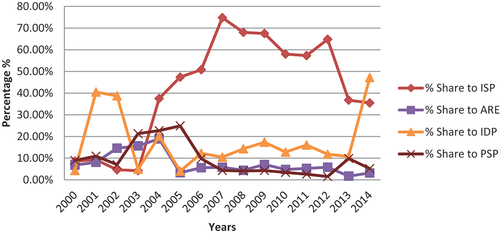
Figure 6. SA % share of agricultural expenditure types.
Source: Compiled from various published budget statements obtained from National Treasury.
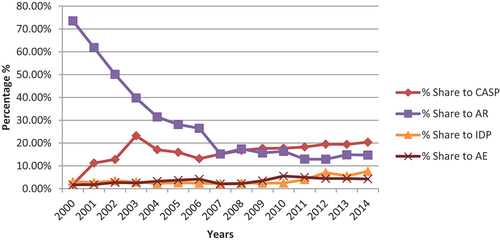
Table 1. Long-run impact of agricultural spending on agricultural growth in Zambia
Table 2. Long-run impact of agricultural spending on agricultural growth in Malawi
Table 3. Long-run impact of agricultural spending on agricultural growth in SA
Table 4. A comparison of government spending priorities against the impact on growth