
Figures & data
Figure 1. Distribution map of chestnut trees in Türkiye (OGM, Citation2021).
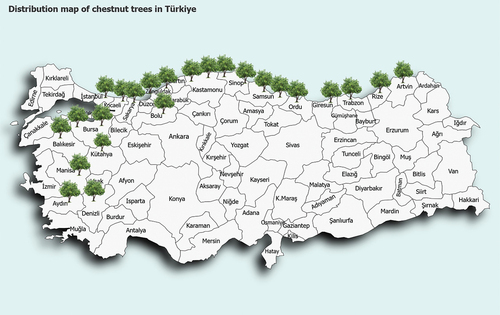
Table 1. Number of enterprises included in the sampling by provinces and strata
Figure 2. Chestnut honey apiary visited during the fieldwork.
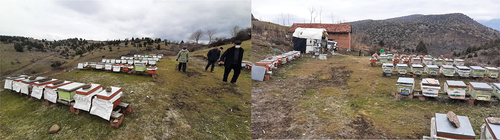
Table 2. Honey yield per hive in beekeeping enterprises as per the enterprise scales and provinces
Table 3. Distributions of cost elements constituting the cost by scales in beekeeping enterprises
Table 4. Honey production costs, sales prices, and net profit per hive by scales and provinces in beekeeping enterprises
Table 5. Comparison of intergroup unit cost, sale price, and profit per hive
Table 6. Pearson’s correlation coefficients of dependent and independent variables included in regression analysis
Table 7. Estimated unit cost regression analysis results for 1 kg of honey