
Figures & data
Table 1. List of rice accessions used for the study with their source and symbols
Figure 1. Map illustrating the experimental site of the study.
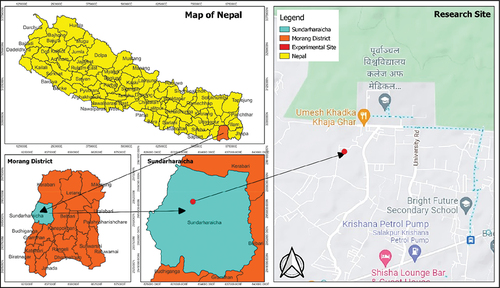
Table 2. Meteorological parameters throughout the study period
Figure 2. Morphological diversity of panicles in studied rice accessions.
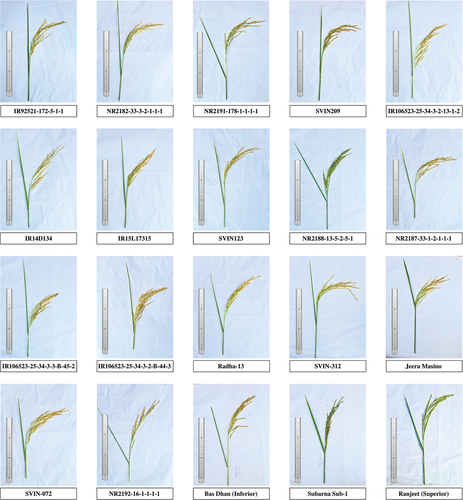
Figure 3. Comparing panicle architecture traits in rice accessions, top five and bottom five performers for each trait including (a)panicle length, (b)panicle angle, (c)panicle weight and (d)test weight.
Figure 4. Comparing panicle architecture traits in rice accessions, top five and bottom five performers for each trait including (e)panicle number, (f)grains/panicle, (g)chaffs/panicle and (h)flagleaf area.
Table 3. Evaluation of major panicle traits of various rice accessions tested under Eastern terai region of Nepal
Table 4. Statistical overview of panicle traits variation among investigated rice accessions
Table 5. Analysis of genetic variability parameters for panicle traits in rice accessions, including genotypic variation (σ2G), phenotypic variation (σ2P), environmental variance (σ2E), environmental coefficient of variation (ECV), genotypic coefficient of variation (GCV), phenotypic coefficient of variation (PCV), broad sense heritability (h2bs), genetic advance (GA), and genetic advance as percentage of the mean (GAM)
Figure 5. Scree plot of eigen values after principal component analysis (PCA).
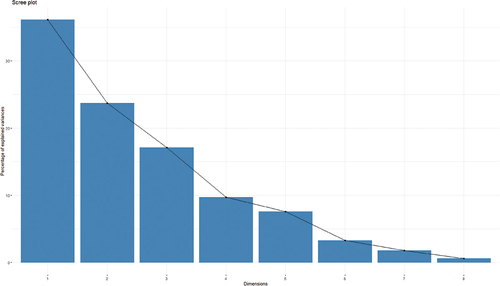
Figure 6. Principal component analysis (PCA) of studied rice accessions showing the genotypic relationship in a graphical representation (biplot) on the basis of different panicle traits.
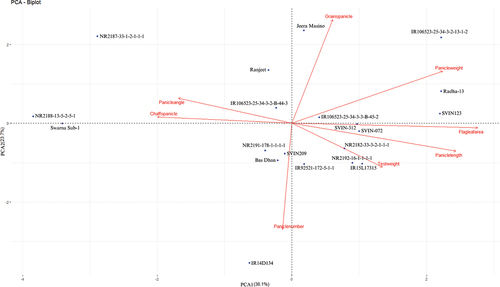
Table 6. Principal component analysis (PCA) of diverse morphological traits in investigated rice accessions
Figure 7. Relationship of different panicle traits in studied rice accessions by multiple correlation analysis [*Significant at 5% level of significance, **Significant at 1% level of significance, ***Significant at 0.1% level of significance, ▪Significant at 10% level of significance].
![Figure 7. Relationship of different panicle traits in studied rice accessions by multiple correlation analysis [*Significant at 5% level of significance, **Significant at 1% level of significance, ***Significant at 0.1% level of significance, ▪Significant at 10% level of significance].](/cms/asset/f6060945-3efe-496f-b0cf-fd8697b3b8d9/oafa_a_2238420_f0007_oc.jpg)
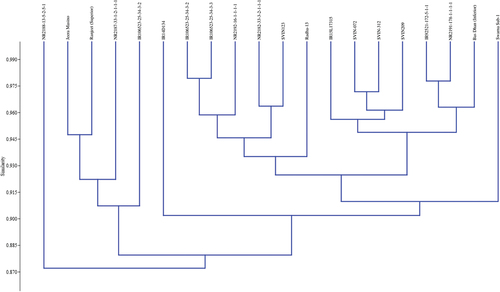
Figure 8. Dendrogram illustrating the similarity index among various rice accessions based on diverse panicle traits.
Data availability statement
Data included in article/supplement material/referenced in the article. https://drive.google.com/file/d/1A2e12TV6JedCicfl2dcHL4XkeNnuh376/view?usp=sharing