Figures & data
Figure 1. A schematic diagram showing the relationship between vulnerability factors and extreme climate events.
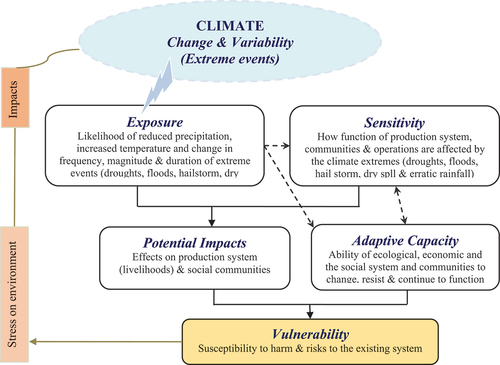
Figure 2. Map of the study area.
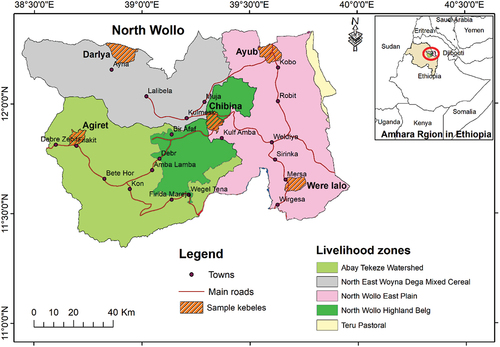
Figure 3. Rainfall and temperature distribution of North Wollo (1998–2019).
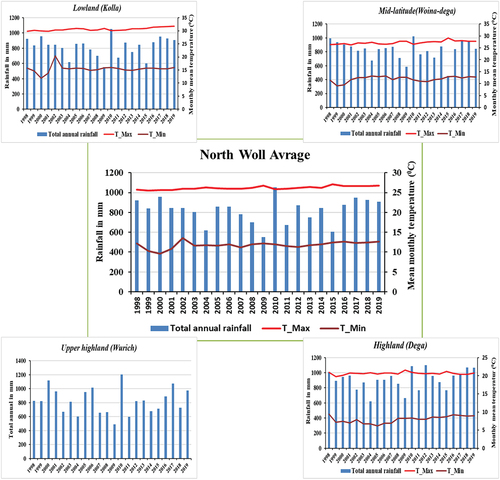
Table 1. Levels of scoring for the proposed livelihood vulnerability indicators
Table 2. Test statistics to determine the appropriate principal components
Table 3. Normalized values and vulnerability scores for the sub-components used to measure exposure
Figure 4. Trend of temperature change in North Wollo (2000 – 2019). Kobo & Mesra stations for North Wollo East plain (NWEP); Lalibela for North east woina-dega mixed cereal (NEWMC); Debrezebit for Abay Tekez watershed (ATW); Kone for North Wollo highland belg (NWHB) livelihood zones. Red-colored trend lines and equations show the temperature trend of the recent decade.
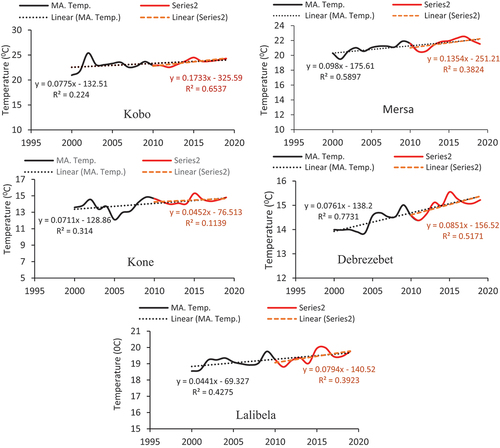
Table 4. Farmers sensitivity to the biophysical environment and agricultural system
Table 5. Adaptive capacity of the agricultural system in North Wollo, 2020
Figure 5. Spider diagram showing the vulnerability scores of major components across the livelihood zones (a), and wealth ranks (b); Triangular diagram showing the contributing factor scores of livelihood zones (c), and wealth rankings (d), North Wollo, 2020.
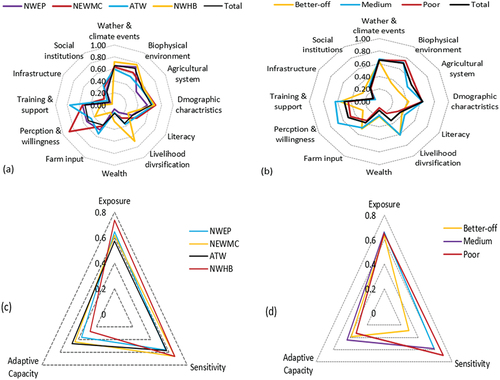
Table 6. Vulnerability scores of major indicators and the overall livelihood vulnerability to droughts in North Wollo, 2020
Figure 6. Vegetation health index (VHI) based agricultural drought frequency in North Wollo (2000–2019) across the livelihood zones. NWEP = North Wollo East plain; NEWMC = North east woina-dega mixd cereal; ATW = Abay Tekez watershed; NWHB = North Wollo highland belg; TP = True pastoral livelihood zones.
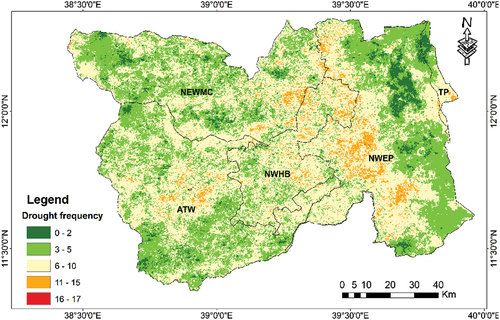
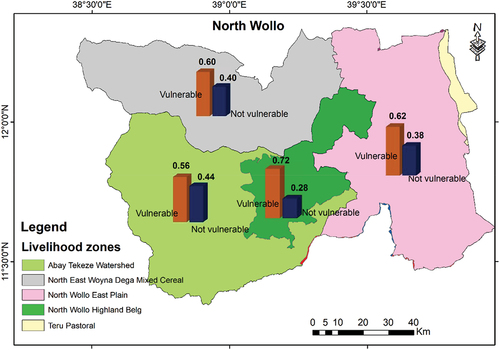
Figure 7. Livelihood zone-based agricultural livelihood vulnerability using LVIVSBA in North Wollo, 2020.