Figures & data
Figure 1. The geophysical location and experiment field of our study area. The polygons with black outlines are two transects for super high-resolution UAV observations. A. Straw mulching ridge tillage (SMRT), B. Straw mulching strip-till+no-till (SMSTNT), C. Straw mulching wide-narrow row strip-till (SMWRST), D. Straw returning mulch tillage (SRMT), E. Straw mulching wide-narrow row no-till (SMWRNT), F. Straw mulching-deep plowing returning to the field in turn (SMPR) respectively.
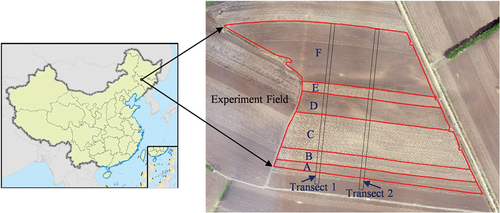
Figure 2. Six tillage experiments and associated photographs in 2022 (The photographs were taken on 27 May 2022).
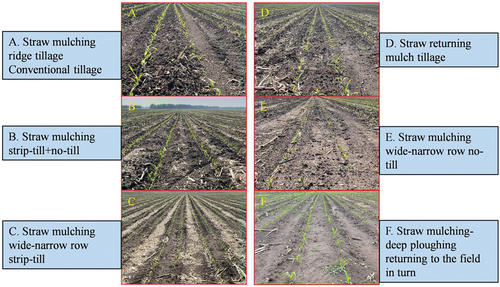
Table 1. The detailed information for six tillage experiments
Table 2. The detailed band information for DJ Phantom 4-multispectral
Figure 3. The frame diagram of this study.
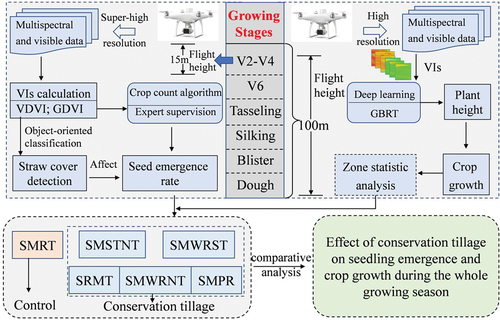
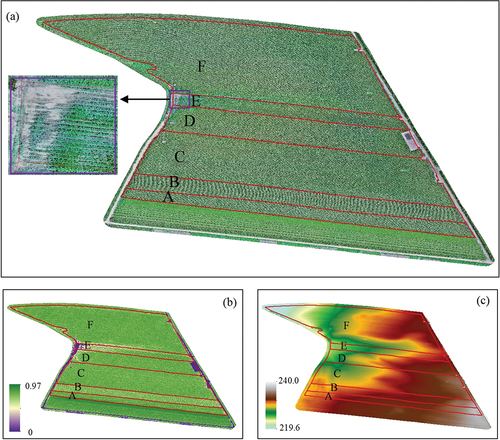
Figure 4. Spatial distribution of maize residues pattern across the experiment field. A-F represent the six tillage experiments including SMRT, SMSTNT, SMWRST, SRMT, SMWRNT, and SMPR respectively.
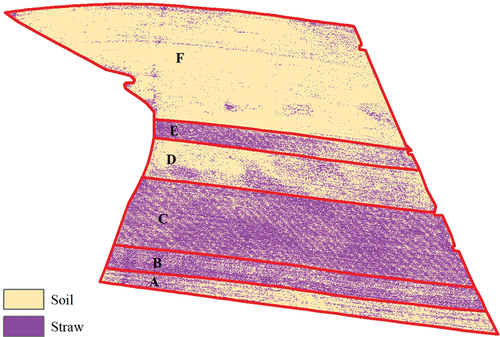
Figure 5. Maize plants are counted by the precision agriculture toolkit at different growth stages.
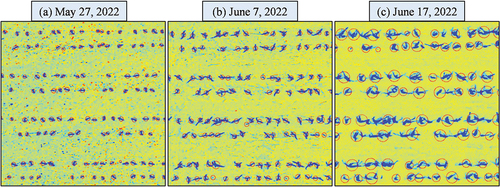
Table 3. The identified accuracy obtained from quadrats statistical results
Figure 6. Emergence rate and corresponding straw cover percentages for treatments A-F.
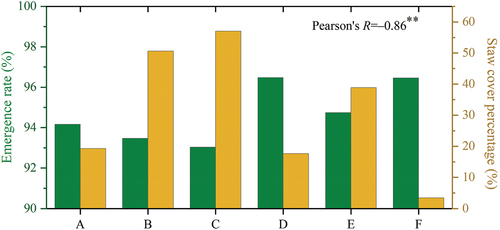
Table 4. The crop diameter and uniformity for different tillages
Figure 7. Mean and standard deviations in NDVI (a, b) and plant height (c, d) for each treatment during the growing season. A-F represent the six tillage experiments including SMRT, SMSTNT, SMWRST, SRMT, SMWRNT, and SMPR respectively. When calculating the mean and std values, the values of waterlogging areas was masked with the threshold of NDVImean-0.5NDVIstd in 24 August.
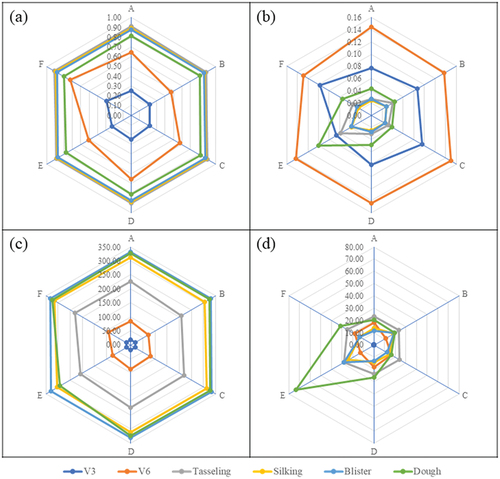
Figure 8. The spatial distribution and zonal statistics of simulated yield across six tillage treatment. When calculating the zonal mean and std values, the values of waterlogging areas was masked with the threshold of NDVImean-0.5NDVIstd in 24 August.
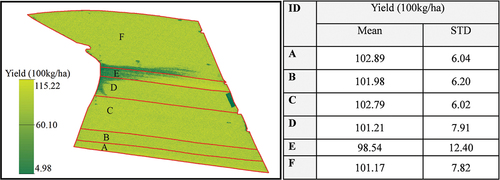
Figure 9. The waterlogging observed from UAV visible images (27 July, a), NDVI (27 July, b), and DSM images (27 May) for our experimental field.