Figures & data
Table 1. Descriptive statistics
Figure 1. Graphical trends of the variables.
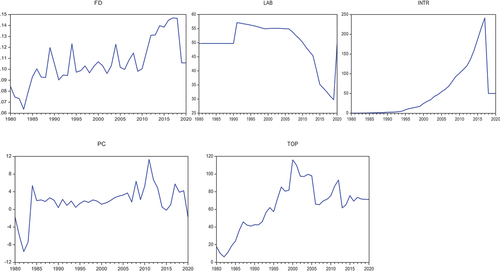
Table 2. Unit root test results: ADF and PP test
Table 3. Results of bounds test for existence of cointegration
Table 4. Estimation of long run results
Table 5. Estimates of short-run results of error correction model
Table 6. Residual diagnostic test
Figure 2. CUSUM Plot.
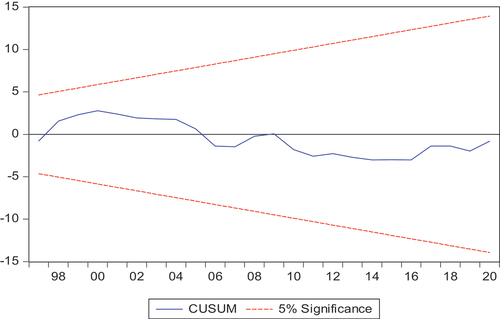
Figure 3. CUSUMSQ Plot.
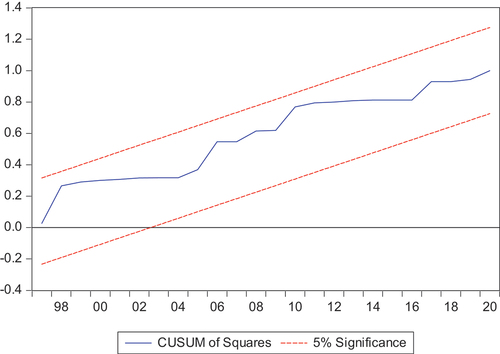
Table 7. Results of the pairwise Granger causality tests
Table 8. Variance decomposition results
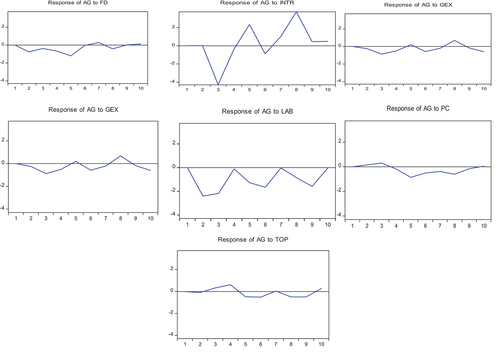
Figure 4. Impulse response results.