
Figures & data
Figure 1. Determination of the minimum inhibitory concentration (MIC) for green synthesized SeNPs, extract, and ciprofloxacin against S. aureus, E. coli, and C. diphtheria. Following the incubation period, resazurin dye was added. Column 1: a negative control (the natural blue/purple color of resazurin reduced to red-colorless). The plate contains concentrations ranging from 0.5 mg/ml at the highest point to 0.03125 mg ml−1 at the lowest point, both of which were achieved using double serial dilution. The MIC value was calculated using the concentration of combinations in Column 8, which did not change color significantly. Wells content varied in concentration from 0.05 to 0.03125 mg/ml.
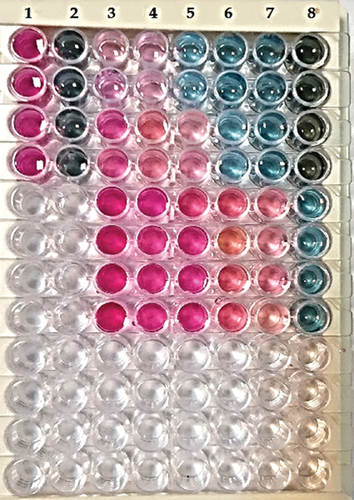
Figure 2. (A) demonstrated a reduction of Se (IV) to Se by changing the color of the SS solution to ruby red. (0). (B) UV-vis spectra of green SeNPs synthesized with V. arctostaphylos (L.) fruit extract (10% w/v).
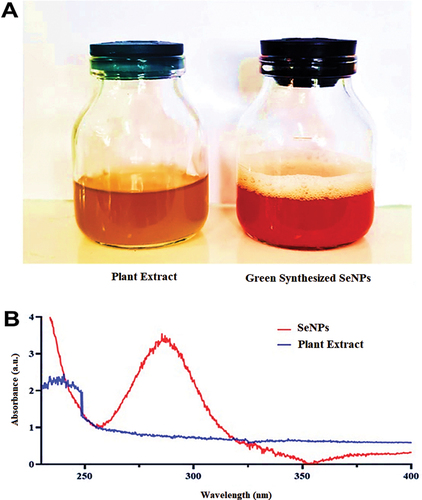
Figure 3. FT‐IR spectrum analysis of green synthesized SeNPs by using fruit extract of V. arctostaphylos (L.) as a capping agent.
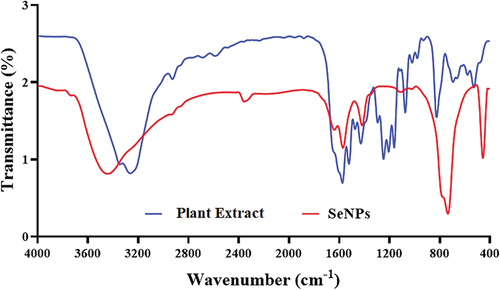
Table 1. Absorption peaks observed in the FTIR spectra, the corresponding functional groups and interpretations
Figure 4. Analysis of morphology and elements distribution. (A) the FESEM analysis of synthesized SeNPs revealed uniformly distributed round shaped particles with an average size of around 50 ± 1.23 nm. (B) EDX-synthesised SeNPs’ elemental distribution.
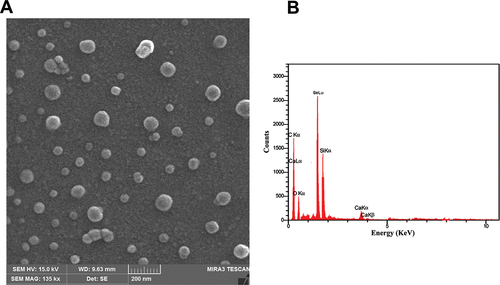
Figure 5. DLS and ZP tests of green synthesized SeNPs. (A) Determination of Size (nm) using DLS. (B) Detection of zeta potential average (mV).
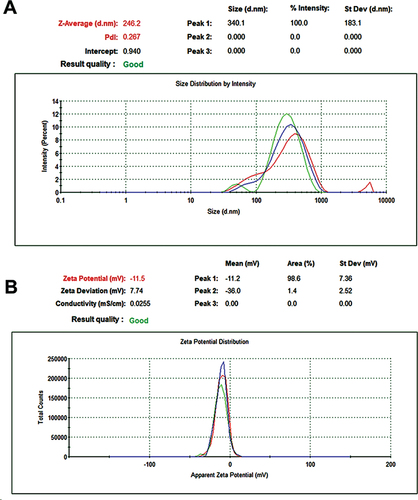
Table 2. Estimation of the MIC and MBC by resazurin microdilution method of green synthesized SeNPs and ciprofloxacin antibiotic against Staphylococcus aureus, Escherichia coli, and Corynebacterium diphtheriae
Table 3. Estimation of the MIC and MBC by resazurin microdilution method of extract and ciprofloxacin antibiotic against Staphylococcus aureus, Escherichia coli, and Corynebacterium diphtheriae
Figure 6. The zone inhibition effect of different concentrations of the green synthesized nanoparticles and the fruit extract on the Staphylococcus aureus, Escherichia coli, and Corynebacterium diphtheriae.
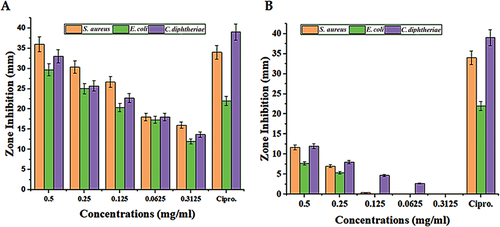
Table 4. The zone inhibition effect of different concentrations of the green synthesized nanoparticles and the Vaccinium arctostaphylos (L.) fruit extract on the Staphylococcus aureus, Escherichia coli, and Corynebacterium diphtheriae
Table 5. The zone inhibition effect of different concentrations of the Vaccinium arctostaphylos (L.) fruit extract on the Staphylococcus aureus, Escherichia coli, and Corynebacterium diphtheriae
Table 6. Determination of the viable, injured, and dead cell percentage after treatment with different concentrations of green synthesized SeNPs using propidium iodide stain and flow cytometry
Figure 7. Determination of the live/dead percentage of Escherichia coli after treating with different concentrations of green synthesized SeNPs and Vaccinium arctostaphylos (L.) extract using propidium iodide stain and flow cytometry.
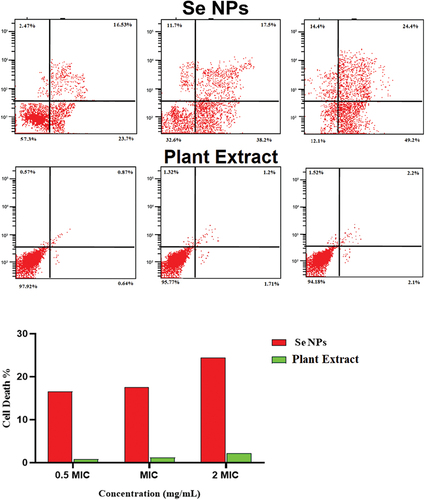
Figure 8. Determination of the live/dead percentage of Staphylococcus aureus after treating with different concentrations of green synthesized SeNPs and Vaccinium arctostaphylos (L.) extract using propidium iodide stain and flow cytometry.
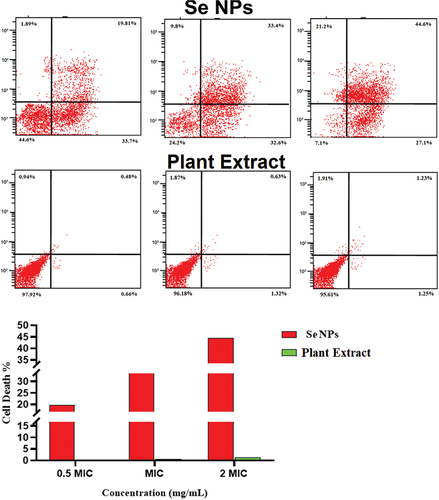
Figure 9. Determination of the live/dead percentage of C. diphtheriae after treating with different concentrations of green synthesized SeNPs and Vaccinium arctostaphylos (L.) extract using propidium iodide stain and flow cytometry.
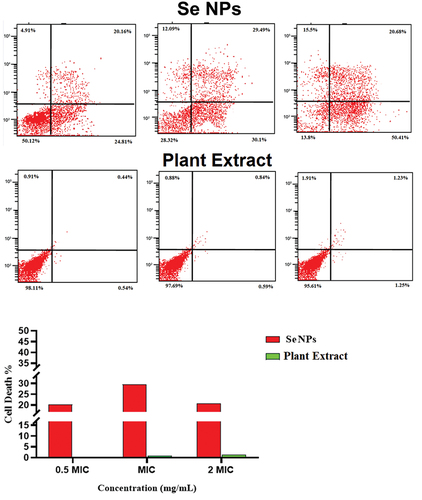
Table 7. Determination of the viable, injured, and dead cell percentage after treatment with different concentrations of Vaccinium arctostaphylos (L.) fruit extract using propidium iodide stain and flow cytometry
Data availability statement
The data that support the findings of this study are available from the corresponding author on reasonable request