
Figures & data
Figure 1. Map of Cape Coast Metropolitan Assembly showing study areas.
Source: Centre for Remote and Geographic Information Services, 2021.
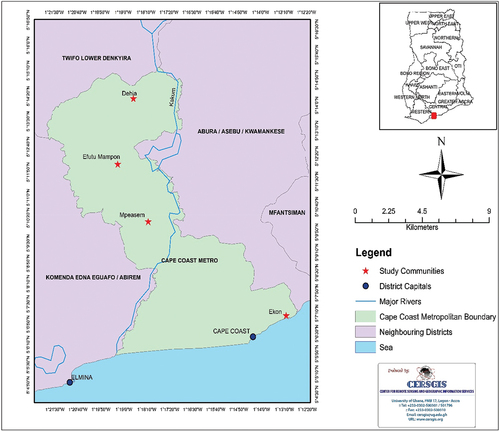
Table 1. Independent variables used
Table 2. Farmers demographic characteristics
Table 3. Summary statistics of continuous variables
Table 4. Multiple linear regression estimation of CVAS on maize yield
Figure 2. Overlap plot of CVAS adoption.
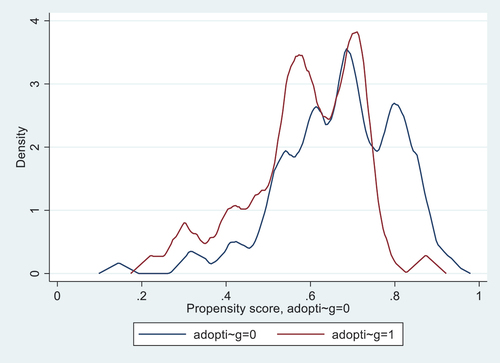
Table 5. Treatment effects estimation of CVAS on maize yield