Figures & data
Figure 1. Evolution of soil oxyfluorfen concentration (mean ± standard error, n = 3) during the experimental period.
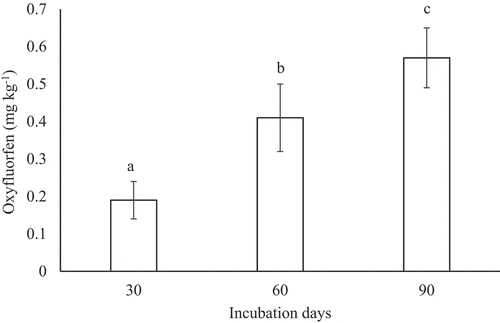
Figure 2. Evolution of dehydrogenase activity (μg INTF g−1 h−1) (mean ± standard error, n = 3) in control and oxyfluorfen-polluted soil during the experiment. Columns with the same letter(s) do not present significant differences (p > 0.05). INTF: 2-p-iodo-3-nitrophenyl formazan.
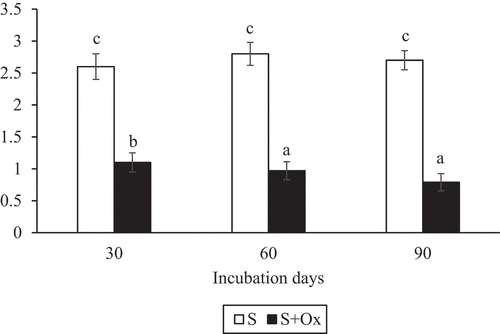
Figure 3. Cultivable bacterial population (mean ± standard error, n = 3) in control and oxyfluorfen-polluted soil during the experiment. (a) Number of colony forming units (CFU) per mL; (b) Number of bacteria. Columns with the same letter(s) do not present significant differences (p > 0.05).
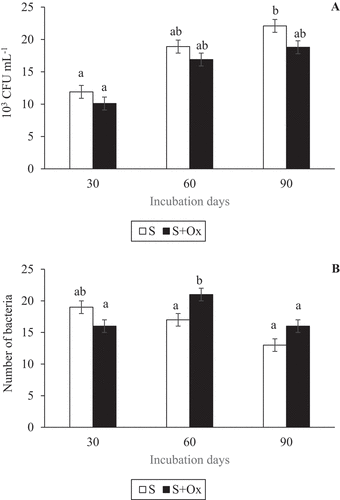
Figure 4. Box-PCR dendrograms. (a) Strains isolated from control soils after 30 days; (b) Strains isolated from polluted soils with oxyfluorfen after 30 days; (C) strains isolated from control soils after 60 days; (d) Strains isolated from polluted soils with oxyfluorfen after 60 days; (e) Strains isolated from control soils after 90 days; (f) Strains isolated from polluted soils with oxyfluorfen after 90 days.
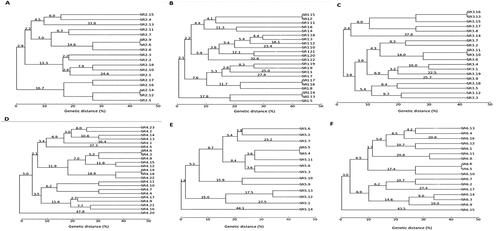
Figure 5. Cultivable bacterial populations during the experiment. (a) Dendrogram for all the strains isolated from control soils after 30 (strains SR1), 60 (strains SR3), and 90 (strains SR5) days; (b) Dendrogram for all the strains isolated from soils polluted with oxyfluorfen after 30 (strains SR2), 60 (strains SR4), and 90 (strains SR6) days.
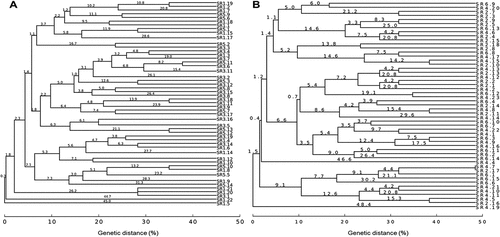
Figure 6. Cultivable bacterial populations in control and polluted soils at the same time points. (a) Dendrogram for all the strains isolated from control soils (strains SR1) and soils polluted with oxyfluorfen (strains SR2) after 30 days; (b) Dendrogram for all the strains isolated for control soils (strains SR3) and soils polluted with oxyfluorfen (strains SR4) after 60 days; (c) Dendrogram for all the strains isolated from control soils (strains SR5) and soils polluted with oxyfluorfen (strains SR6) after 90 days.
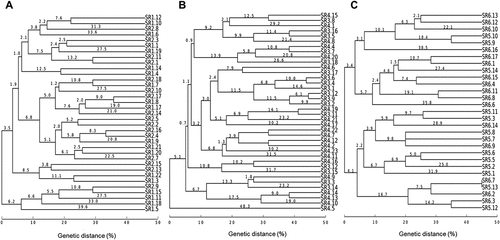
Table 1. PGP properties of the strains isolated from control and those polluted with oxyfluorfen at different times
Table 2. PGP properties exhibited by the same species at different oxyfluorfen concentrations in soils
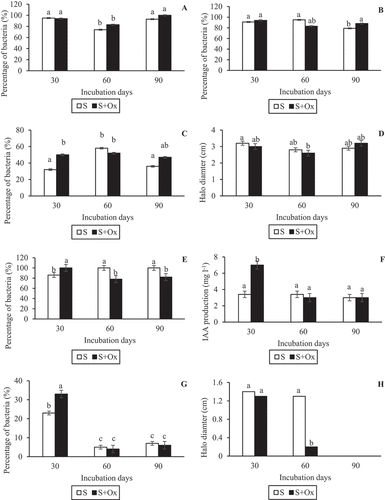
Figure 7. Evolution of the PGP properties (mean ± standard error, n = 3) in isolated bacteria for control and polluted soils during the experimental period. (a) Percentage of bacteria with biofilm-formation capacity; (b) Percentage of bacteria with nitrogen-fixation capacity; (c) Percentage of bacteria with siderophore-production capacity; (d) Siderophores production (chelation halo of chelation) by bacteria; (e) Percentage of bacteria with IAA-production capacity; (f) IAA production by bacteria; (g) Percentage of bacteria with phosphate-solubilisation capacity; (h) Phosphate solubilisation (solubilisation halo of solubilisation) by bacteria. Columns with the same letter(s) do not present significant differences (p > 0.05).