
Figures & data
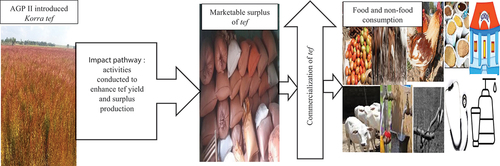
Figure 1. Conceptual framework on Korra tef adoption and farm households’ welfare.
Figure 2. Map of the study areas.
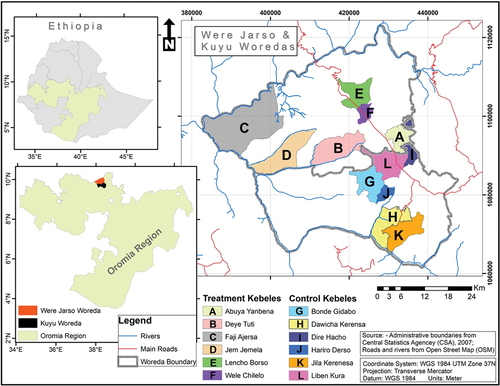
Table 1. Distribution of population and sample households across the study kebeles
Table 2. Consumption expenditures considered for calculating household welfare
Table 3. Definition and measurements of the independent variables used in the study
Table 4. Statistical summary of x2-test distribution for dummy and categorical variables
Table 5. Statistical summary of t-test for continuous variables
Table 6. Average tef production and net income by respondent types
Table 7. Categories of commercialization of tef producers in 2020
Table 8. HCI of tef producers in 2020
Figure 3. Kernel density estimate of household commercialization Index (HCI).
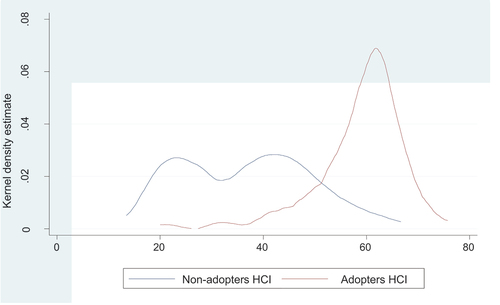
Table 9. The average expenditures of farm households
Table 10. The average expenditures of farm households (Etb/person/annum) vis-a-vis the HCI
Table 11. One-way ANOVA result for a comparison of expenditures of farm households with the levels of their commercialization
Table 12. Result of the VIF
Table 13. Contingency coefficients test for discrete variables
Table 14. Probit regression of adoption
Table 15. Propensity score and covariate matching for the variables used
Table 16. Comparison of the matching estimators for both productivity and income
Table 17. Distribution of estimated propensity scores
Figure 4. Distribution of propensity score generated from Kernel matching (0.1).
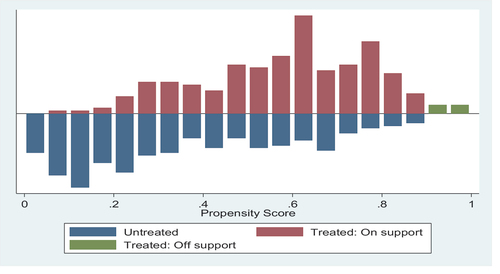
Table 18. Total expenditures per adult result of average treatment effect on the treated (ATT)
Table 19. Rosenbaum bounds sensitivity analysis (Kernel matching algorithm, bandwidth = 0.1)
Data availability statement
The data used to support the findings of this study are available from the corresponding author upon request.