
Figures & data
Table 1. Regional division concerning carbon sources and carbon sinks
Table 2. Carbon emission coefficients of different agricultural input factors
Table 3. Economic coefficients and carbon absorption rates of main crops
Figure 1. Overall characteristics of carbon sources of planting industry in China during 2000–2020(ten thousand tons).
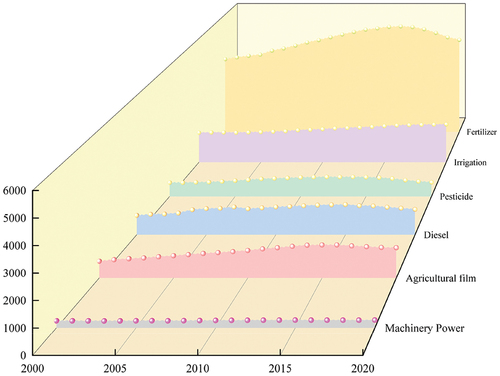
Figure 2. Overall characteristics of planting carbon sinks in China from 2000 to 2020 (ten thousand tons).
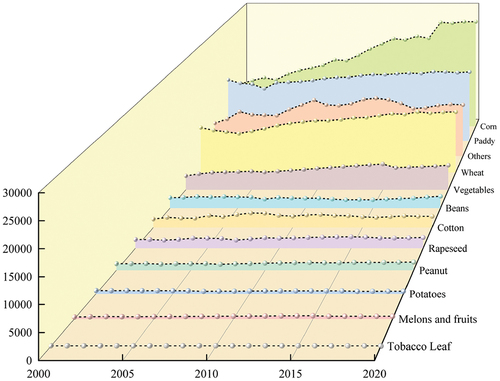
Figure 3. Overall characteristics of net carbon sinks of planting industry in China from 2000 to 2020(ten thousand tons).
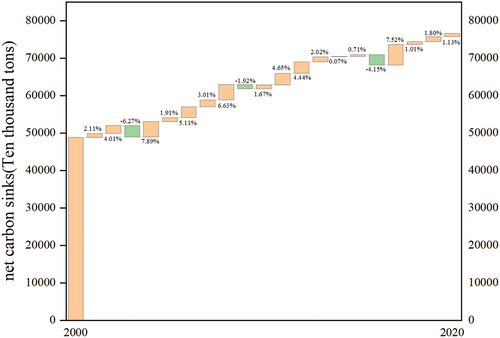
Figure 4. Regional distribution of carbon sources, carbon sinks and net carbon sinks of planting industry during 2000–2020 (a: carbon sources; b: carbon sinks; c:net carbon sinks, ten thousand tons).
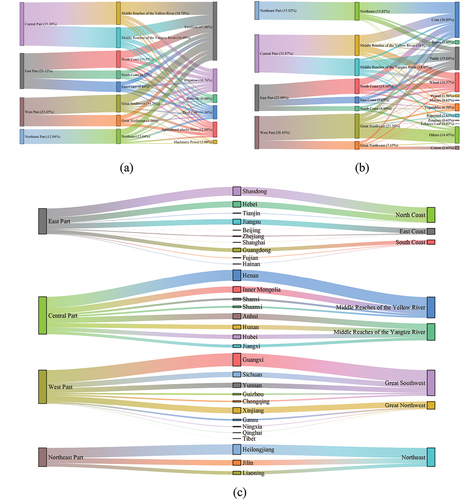
Figure 5. Interprovincial distribution of planting carbon sources in China, 2000–2020 (ten thousand tons).
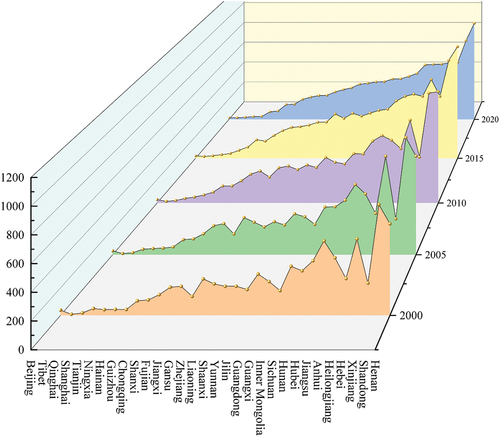
Figure 6. Interprovincial distribution of carbon sinks in China’s planting industry from 2000 to 2020 (ten thousand tons).
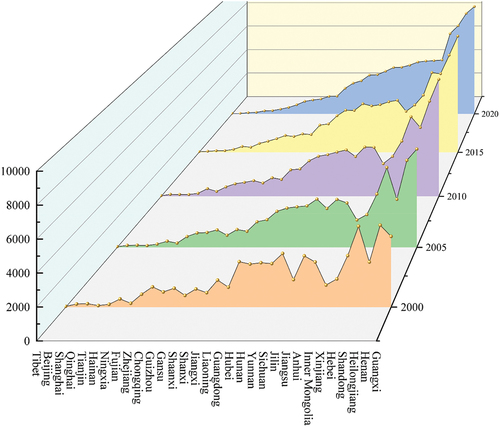
Figure 7. Provincial distribution of planting industry net carbon sinks in China from 2000 to 2020 (ten thousand tons).
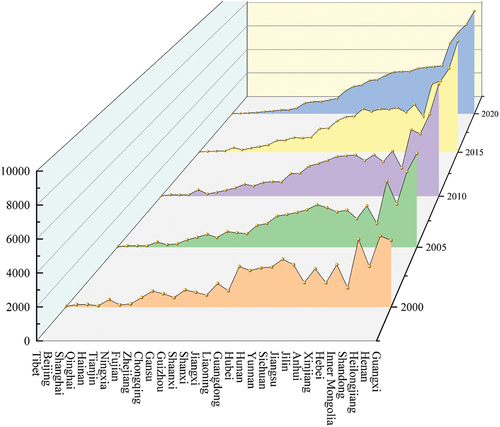
Table 4. Descriptive statistics table for main variables
Table 5. Theil index of carbon sources from 2000 to 2020
Table 6. Theil index of regional carbon sources from 2000 to 2020
Table 7. Theil index of carbon sinks from 2000 to 2020
Table 8. Theil index of regional carbon sinks from 2000 to 2020