
Figures & data
Table 1. Sunflower seed production in the 15 top-producing countries
Figure 1. Sunflower seed production, top 10 producers in Africa. Source: FAOSTAT (Citation2022).
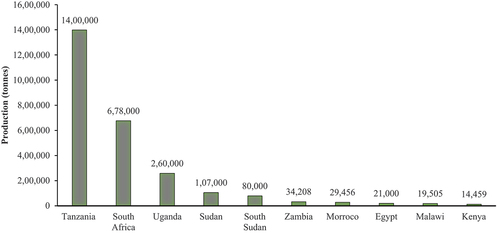
Figure 2. Status of sunflower production in Tanzania from 2010 to 2020.
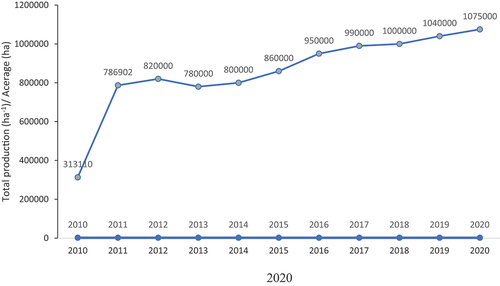
Figure 3. Map showing sunflower growing regions in Tanzania. Source: Majule (Citation2017).
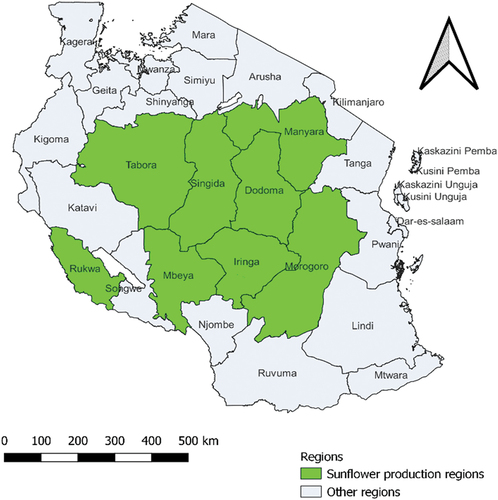
Figure 4. Map indicating the inter-relationship between land degradation and sunflower production in Tanzania. Source: Majule (Citation2017).
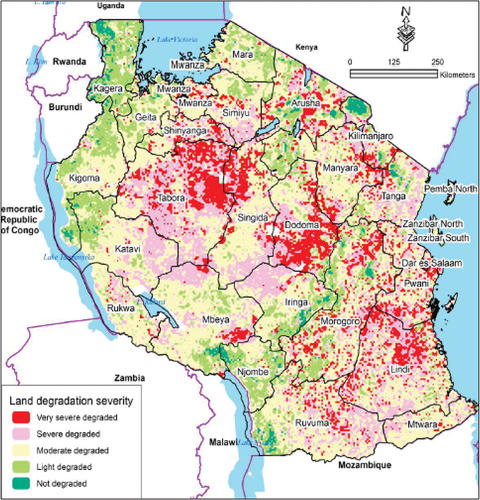
Table 2. Soil-based nutrient parameter status in Tanzania
Table 3. Sunflower nitrogen uptake, yield, and stover yield under intercropping approaches
Table 4. Sunflower growth and yield parameters from different ISFM approach