
Figures & data
Figure 1. Map of the study areas.
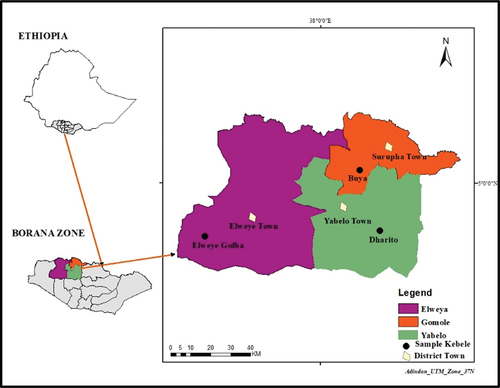
Table 1. Description local name for landscapes and classification criteria of feed resources
Table 2. Household characteristics of respondents in study area
Table 3. Land types and area covered in (ha) unit in the study areas
Table 4. Total number of livestock and total number of livestock units within the study areas
Table 5. Diversity of feed types, seasonality, and agro ecology in the study areas
Table 6. Seasonality and agro ecology of camel feed sources in study areas (N = 364)
Table 7. Estimated available dry matter production (tonnes), ME (MJ), and DCP (kg) per feed resource in the study areas
Table 8. Mean estimated annual TDM (tonnes), ME (MJ), and DCP (kg) available, requirement, and balance per study for maintenance of tropical livestock unit in the study area
Table 9. Feed conservation and experiences of feeding from other sources (N = 364)