
Figures & data
Figure 1. Map of Palpa district including study area.
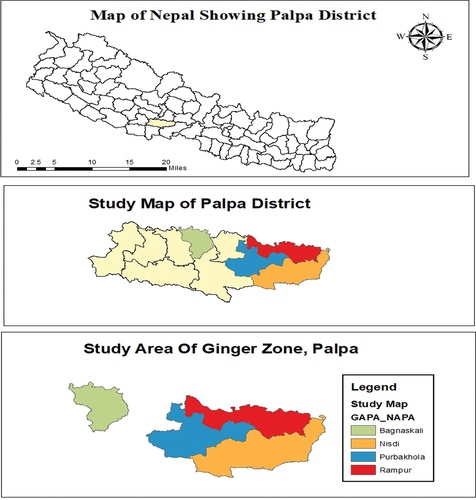
Table 1. Cost of production and B:C ratio of ginger in Palpa, Nepal
Table 2. Cobb-Douglas production function of ginger production in Palpa, Nepal
Table 3. Relationship between family type and annual income of ginger growers in Palpa, Nepal
Table 4. Relationship between grading of ginger and income from ginger in Palpa, Nepal
Figure 2. Value chain mapping of ginger in Palpa, Nepal.
Figure 3. Local value chain (with price) of fresh ginger in Palpa, Nepal.
Figure 4. Local value chain (with price) of dried ginger in Palpa, Nepal.
Table 5. Major actors involved in marketing channels of ginger in Palpa, Nepal
Table 6. Marketing margin and producers’ share of ginger in Palpa, Nepal
Table 7. Factors affecting the price of ginger
Table 8. Players affecting the price of ginger
Table 9. Ranking of production problems of ginger in Palpa, Nepal
Table 10. Ranking of marketing Problems
Table 11. SWOT analysis of ginger in Palpa, Nepal