
Figures & data
Figure 1. Paddy pods from the experiment.
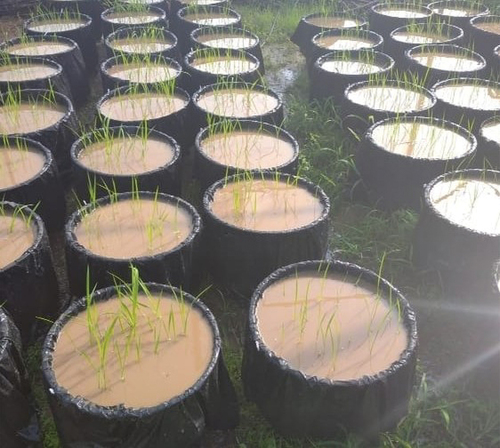
Figure 2. The effects of foliar vermicompost applications on the amount of chlorophyll.
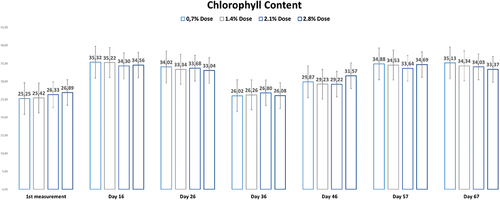
Figure 3. The effects of vermicompost applications applied from the soil on the amount of chlorophyll according to the days.
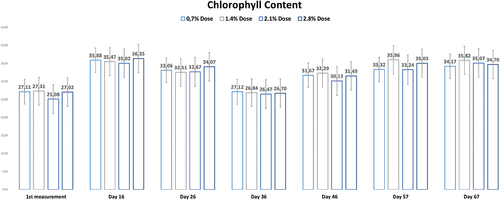
Figure 4. The application stages of the experiment.
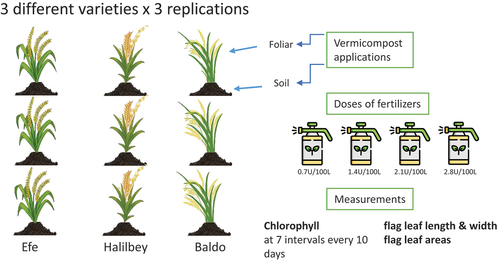
Table 1. Mean squares and significance levels of cultivars, treatments, doses and interactions on chlorophyll content
Table 2. Descriptive statistics and multiple comparison results of chlorophyll content
Table 3. Descriptive statistics and multiple comparison results of chlorophyll content
Table 4. Descriptive statistics and multiple comparison results of chlorophyll content
Table 5. Comparison of leaf length by cultivar, treatment and dose
Table 6. Descriptive statistics and multiple comparison results of leaf length by cultivar, treatment and dose
Table 7. Comparison of leaf width by cultivar, treatment and dose
Table 8. Descriptive statistics and multiple comparison results of leaf width by cultivar, treatment, and dose
Table 9. Comparison of leaf area by cultivar, treatment and dose
Table 10. Descriptive statistics and multiple comparison results of leaf area by cultivar, treatment and dose