
Figures & data
Figure 1. Map of Burkina Faso showing the study sites in two agroecological zones.
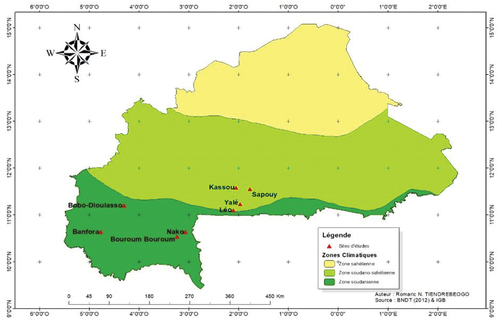
Table 1. Statute and gender data of cashew producers in the two zones
Table 2. Age distribution and education levels of cashew producers in the study areas
Figure 2. Sources of cashew seedling materials.
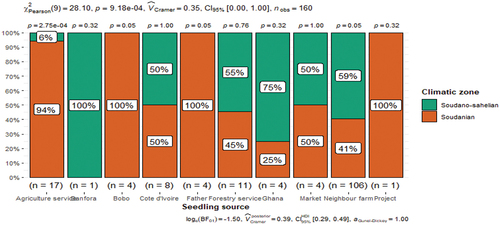
Figure 3. Cashew plants spacing in orchards.
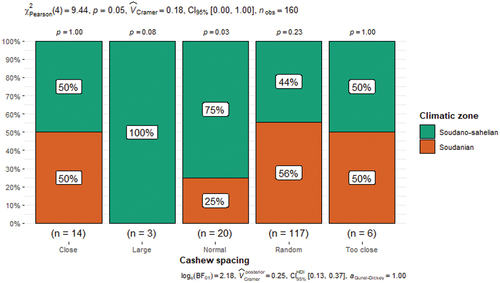
Table 3. Distribution of cashew total yield average according climatic zones
Figure 4. Inter-crops identity in association with cashew plants in orchards.
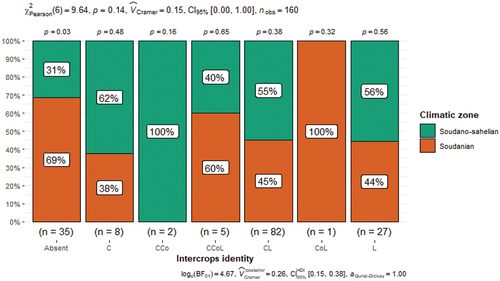
Figure 5. Constraints encountered by cashew producers.
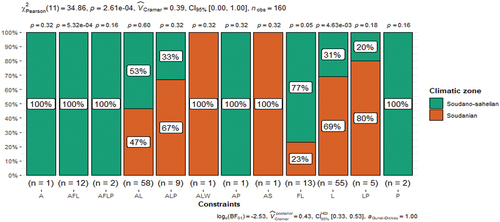
Figure 6. Pesticides used in orchards to control inter-crops from pests.
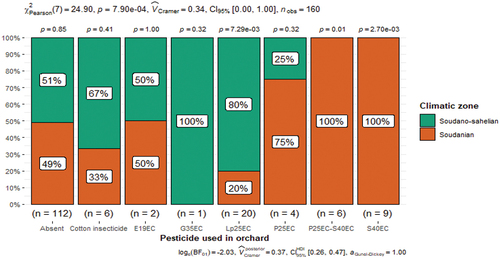
Figure 7. Pesticides and practices used for Apate terebrans and Diastoscera trifasciata management.
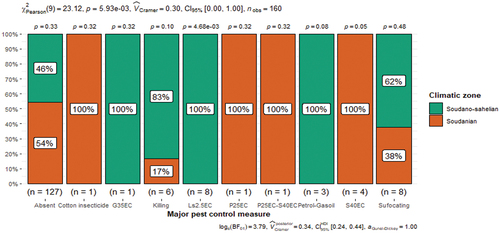
Table 4. Correlation within some continuous variables