
Figures & data
Figure 1. Location of the study area.
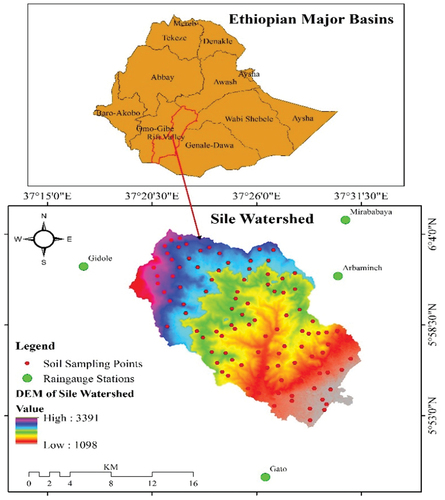
Table 1. The metrological stations and satellite data used in this study
Table 2. Description of the driving GCMs used in this study
Table 3. Major LULC types and their descriptions (Bewket & Teferi, Citation2009; Gelagay & Minale, Citation2016)
Table 4. Land cover classes and assigned cover (C) factor values
Table 5. LULC and slope classes with assigned P-values
Figure 2. Overall study framework used to estimate soil erosion.
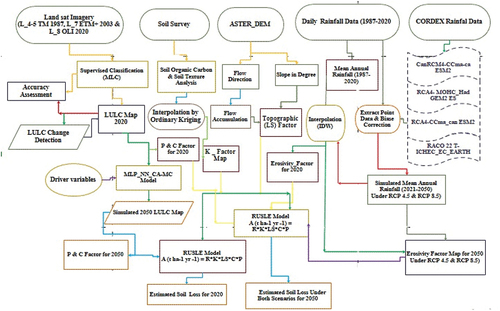
Table 6. Classification accuracy assessment result for 1987, 2003, and 2020
Figure 3. LULC map (a) 1987, (b) 2003, (c) 2020, and (d) 2050 in Sile watershed.
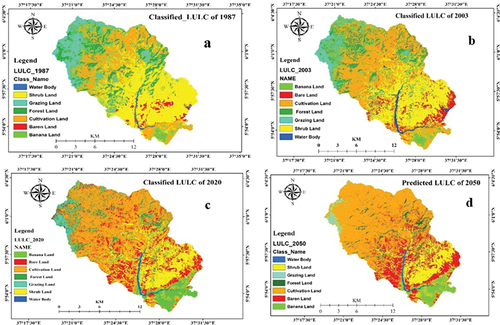
Table 7. Expected change of future LULC (2050) in study area
Table 8. Ensemble RCM performance evaluation
Figure 4. R factor map (A) 1987, (B) 2003, (C) 2020, (D) 2050 under RCP 4.5, and (E) 2050 under RCP 8.5.
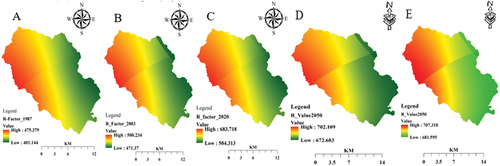
Figure 5. K factor (A) and LS factor (B) map of Sile watershed.
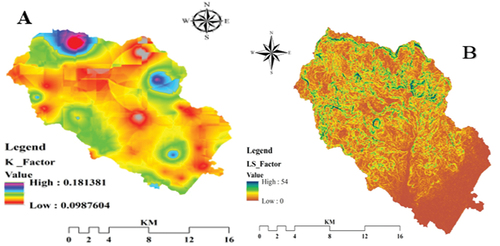
Figure 6. Cover (C) factor map (A) 1987, (B) 2003, (C) 2020, and (D) 2050.
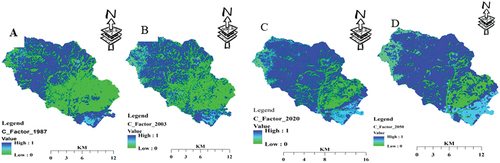
Figure 7. Practice (P) factor map for 1987 (A), 2003 (B), 2020 (C), and 2050 (D).
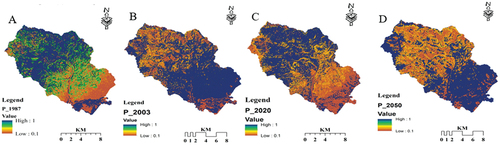
Figure 8. The mean annual soil loss: (A) 1987, (B) 2003, (C) 2020, (D) 2050-RCP4.5, and (E) 2050-RCP8.5.
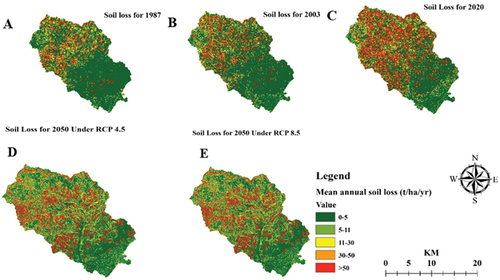
Table 9. Soil erosion under different LULC classes in the study watershed
Figure 9. Estimated soil erosion severity classes based on sub-watershed level in Sile watershed.
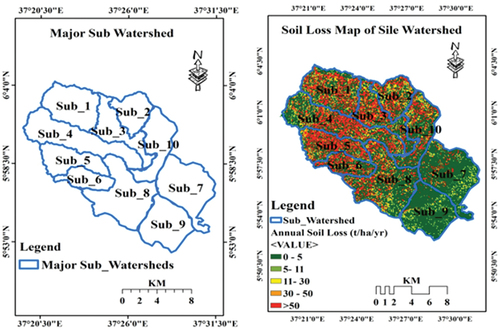
Table 10. Soil erosion severity in sub-watershed level and conservation priority class