
Figures & data
Figure 1. Photographic view of experimental set up in the greenhouse.
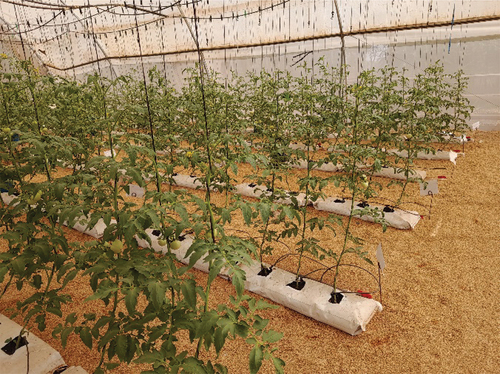
Figure 2. CROPWAT simulated reference evapotranspiration for greenhouse environments 1 and 2.
Table 1. Nutrient recommendations for hydroponic (perlite, rockwool, and NFT) tomatoes in Florida (Peet & Welles, Citation2005) according to cluster formation intervals
Table 2. Estimated crop water requirement and irrigation Interval for soilless cultivated greenhouse tomato at CSIR-SARI, Nyankpala, Ghana, for greenhouse environments 1 and 2
Figure 3a. Day-time temperature under greenhouse environment 1.
Figure 3b. Night-time temperature under greenhouse environment 1.
Figure 4a. Day-time relative humidity under greenhouse environment 1.
Figure 4b. Night-time relative humidity under greenhouse environment 1.
Figure 5a. Day-time temperature under greenhouse environment 2.
Figure 5b. Night-time temperature under greenhouse environment 2.
Figure 6a. Day-time relative humidity under greenhouse environment 2.
Figure 6b. Night-time relative humidity under greenhouse environment 2.
Figure 7. Effects of fertilizer rate on the number of clusters per plant in greenhouse environment 1 (GE 1) and greenhouse environment 2 (GE 2) (error bars = least significant difference (5%).
Figure 8. Effects of irrigation regime on number of clusters per plant in greenhouse environment 1(GE 1) and greenhouse environment 2(GE 2) (error bars = least significant difference (5%).
Figure 9. Effects of genotype on the number of clusters per plant in greenhouse environment (GE 1) and greenhouse environment 2 (GE 2) (error bars = least significant difference (5%).
Figure 10. Effects of fertilizer rate on the number of flowers per plant in greenhouse environment 1 (GE 1) and greenhouse environment 2 (GE 2) (error bars = least significant difference (5%).

Figure 11. Effects of irrigation regime on the number of flowers per plant in greenhouse environment 1 (GE 1) and greenhouse environment 2 (GE 2) (error bars = least significant difference (5%).
Figure 12. Effects of genotype on the number of flowers per plant in greenhouse environment 1 (GE 1) in greenhouse environment 2 (GE 2) (error bars = least significant difference (5%).
Figure 13. Effects of fertilizer rate on the percentage fruit set per plant in greenhouse environment 1 (GE 1) and greenhouse environment 2 (GE 2) (error bars = least significant difference (5%).
Figure 14. Effects of irrigation regime on the percentage fruit set per plant in greenhouse environment 1 (GE 1) and greenhouse environment 2 (GE 2) (error bars = least significant difference (5%).
Figure 15. Effects of genotype on percentage fruit set per plant in greenhouse environment 1 (GE 1) and greenhouse environment 2 (GE 2) (error bars = least significant difference (5%).
Table 3. Correlation between the greenhouse environment parameters and the flower set of greenhouse tomato under greenhouse environment 1
Table 4. Correlation between the greenhouse environment parameters and flower set and fruiting of greenhouse tomato under greenhouse environment 2
Table 5. Average weight per fruit, total aboveground biomass, harvest index and marketable yield of greenhouse tomato as affected by the combination of fertilizer rate, irrigation regime and genotype
Table 6. Crop water productivity and nutrient use efficiency of greenhouse tomato as affected by the combination of fertilizer rate, irrigation regime and genotype
Data availability statement
Data will be available on request through the corresponding author.