
Figures & data
Table 1. Phosphorus solubilization and acid and alkaline phosphatase activity patterns of Bacillus velezensis AR1 in a medium supplemented with tricalcium phosphate (Ca-P) and aluminium phosphate (al-P). Values in a column followed by the same letter are statistically not different (p ≥ 0.05) from each other. Data presented are averages of two experiments with replications of each. DIA indicates days after incubation. Phosphatase activity is reported as unit per milliliter of para-nitrophenyl phosphate (p-NPP). LSD is least significant difference at 5%
Figure 1. Ca-P culture broth pH trends during P-solubilization by Bacillus velezensis AR1. The values presented are mean ± STDV (n = 3). Each pH measurement was repeatedly conducted to get reliable stable readings for precision.
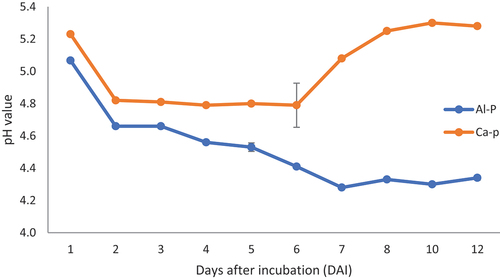
Table 2. Organic acid secreted by Bacillus velezensis AR1 and their concentrations (conc) presented in milligram per liter. Al-P and Ca-P represent medium supplemented with aluminum and calcium phosphates, respectively. Concentrations were calculated from their respective calibration curves indicated on Supplementary Fig. 1D. ND means not detected
Table 3. Bacteria-solubilized P effect on plant growth and tissue nutrient content. Values in the column followed by the same letter are statistically not different (p > 0.05). The values presented are means of three replications. Note that Ck is the control that received KH2 PO4, Al-Pi is aluminum phosphate without AR1; Al-P5 is the AR1 culture broth of days 3, 4, and 5 (pooled); Al-P12 culture broth at day 12. The same for Ca. PH is plant height, RL is root length, DW is dry weight, TN is total nitrogen, and TP is total phosphorus