Figures & data
Figure 1. Sample distribution across periods of the survey.
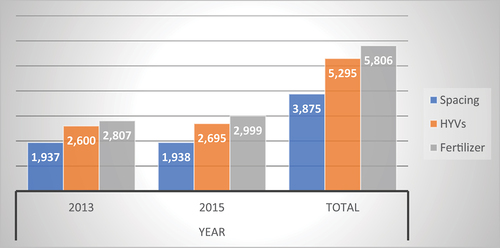
Table 1. FE results row planting: outcome variable is per capita consumption expenditure
Table 2. FE results row planting: outcome variables: ln per capita consumption expenditure, ln child nutrition, food shortage, and worry about food
Table 3. FE, PSM, and ETE methods’ results on the impact of row planting on the welfare of rural households
Table 4. FE results for HYVs: outcome variable is per capita consumption expenditure
Table 5. FE, PSM, and ETE methods’ results on the impact of HYVs on per capita consumption and child nutrition
Table 6. FE method’s results for fertilizer use: outcome variable is per capita consumption expenditure
Table 7. FE, PSM, and ETE methods’ results on the impact of fertilizer use on the welfare of rural households
Table 8. Summaries of FE, PSM, and ETE methods’ results for the three technologies
Table 9. Heterogeneous/Differential impacts of the three technologies by area under improved technology, gender, and observation year
Table A1. A Description of the variables by type for row planting technology
Table A2. Covariate balance indicators before and after matching: quality test
Table A3. Test of sensitivity analysis to hidden biases (Rosenbaum bounds test results)
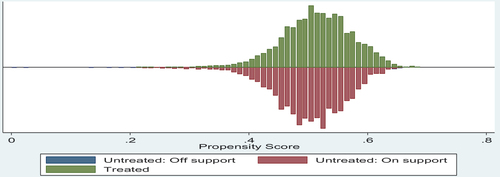
Figure B1. Propensity score distribution and common support for propensity score estimation of technology one: spacing.
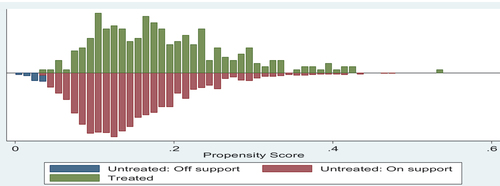
Figure B2. Propensity score distribution and common support for propensity score estimation of technology two: HYVs.
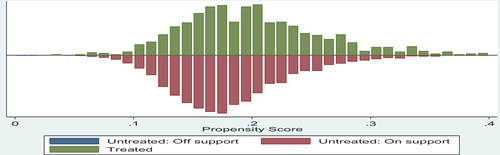
Figure B3. Propensity score distribution and common support for propensity score estimation of technology three: Fertilizers.