
Figures & data
Figure 1. Time series historical trends of the (a) agricultural land per capita, (b) agricultural land use, (c) fertilizer use per capita, and (d) nitrogen fertilizer use per hectare of cropland (1961–2018).
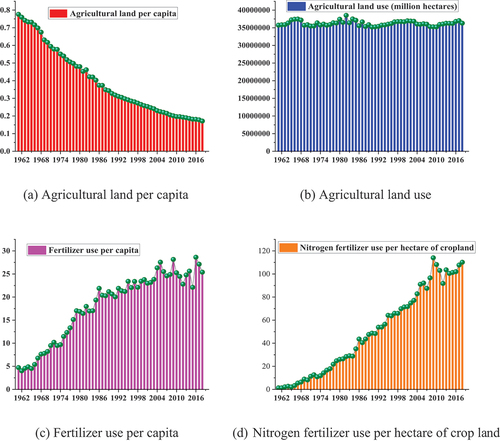
Figure 2. Study mechanism and methodological roadmap.
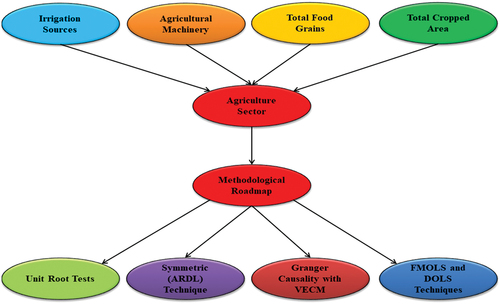
Figure 3. Irrigation sources in Pakistan (e) canals, (f) Wells, and (g) tubewells.
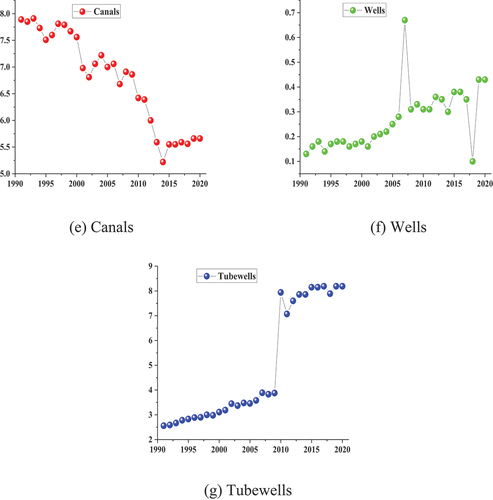
Figure 4. Crops production scenario (h) wheat production, (i) rice production, (j) bajra production, (k) jowar production, (l) maize production, and (m) barley production.
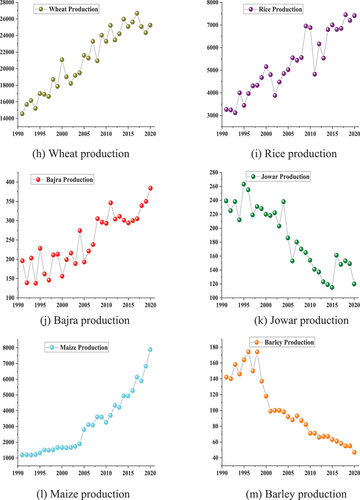
Figure 5. Area under grain crops (000 hectares) (n) area under wheat crop, (o) area under rice crop, (p) area under bajra crop, (q) area under jowar crop, (r) area under maize crop, and (s) area under barley crop.
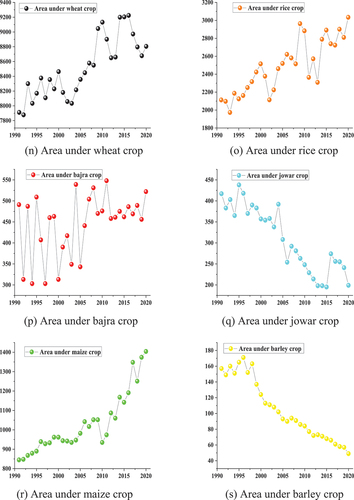
Table 1. Summary statistics
Table 2. Correlation analysis for the variables
Table 3. Unit root tests results
Table 4. Lag length criteria
Table 5. Bounds testing for the cointegration
Table 6. Johansen cointegration test
Table 7. Symmetric analysis results
Table 8. Stability tests outcomes
Figure 6. Graphical representation of (t) CUSUM, and (u) CUSUM of squares.
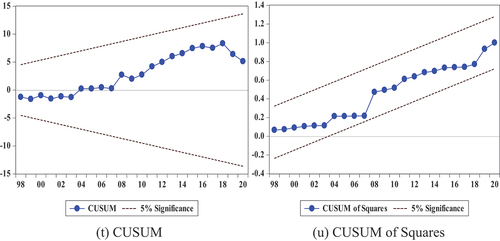
Table 9. Results of FMOLS and DOLS
Figure 7. (V) impulse response function, and (w) variance decomposition analysis.
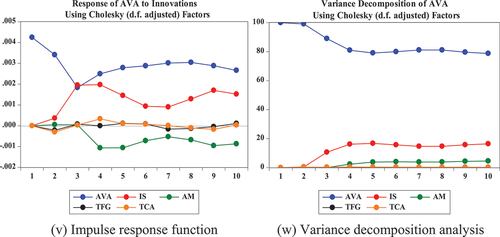
Table 10. Outcomes of GC test under VECM