Figures & data
Table 1. Background information of sites and brief description based on information from the provincial profile statistics (Stats, Citation2018)
Figure 1. An example map from the first mapping exercise of value chain activities, developed by focus group participants from the UMbumbulu community (value chain activities listed from left to right in sequence).
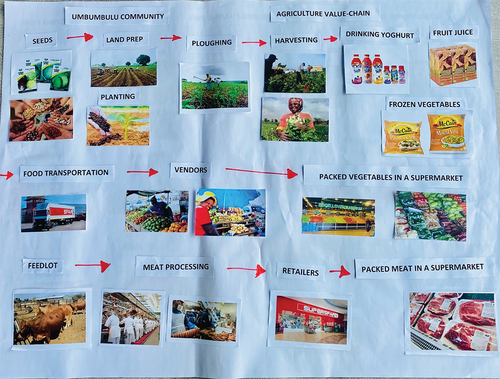
Figure 2. An example map of the second mapping exercise of employment opportunities in the agricultural value chain, as identified by focus group participants from the uMbumbulu community.
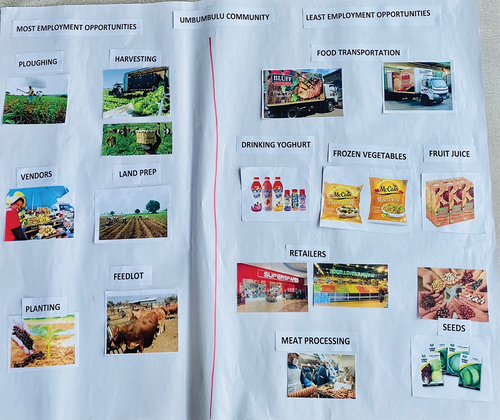
Figure 3. A graphical representation of factors linked to youth’s exposure to agricultural value chain activities based on their current involvement in agriculture. This graph was generated in NVivo, and the factors were based on topics emerging from the coded data (nodes).
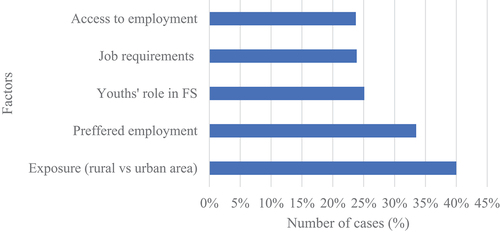
Figure 4. A graphical representation of additional factors related to challenges associated with local agriculture programs targeted at youth. This graph was generated in NVivo, and the factors were based on topics emerging from the coded data (nodes).
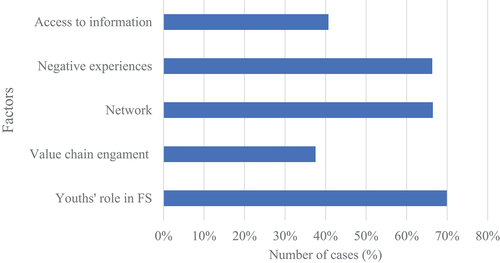
Figure 5. Word tree showing the key phrases associated with ‘responsible’ in the coded data set of all FGD. This word tree is related to who is responsible for attracting youth into agriculture. It was used as the foundation in exploring who the respondents believe is responsible for attracting youth into agriculture.
Table 2. A summary of the respondent’s and institution profiles from the online surveys
Figure 6. A graphical representation of stakeholders' perspectives of youth’s challenges in the labour market. Stakeholders were asked to rank challenges on a scale of 1 to 5 (least to most). This graph was generated based on data collected using Google Forms
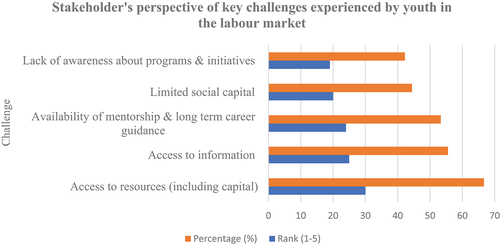
Table 3. Relationship between job title and access to resources
Table 4. Relationship between job titles and stakeholder’s opinion on the influence of social networks on youth awareness of programmes
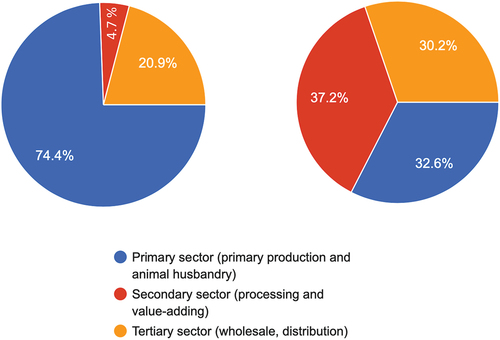
Figure 7. Distribution of stakeholder’s opinion of which sector of the agricultural value-chain has the most support services (panel A, left hand side) and the least support services (panel B, right hand side).