
Figures & data
Table 1. Chemical and physical properties of the sandy soil under study
Table 2. Mineral compositions of moringa leaves
Table 3. Influence of biological substances on branch number/plant and plant height (cm) of D. pinnata under sandy soils during the two seasons of 2021 and 2022
Table 4. Influence of biological substances on number of leaves/branch and shoot dry weight/plant (g) of D. pinnata under sandy soils during the two seasons of 2021 and 2022
Table 5. Influence of biological substances on flower number/plant and flower diameter (cm) of D. pinnata under sandy soils during the two seasons of 2021 and 2022
Table 6. Influence of biological substances on flowering date (day) and stalk length (cm) of D. pinnata under sandy soils during the two seasons of 2021 and 2022
Table 7. Influence of biological substances on stalk diameter (mm) and stalk fresh weight (g) of D. pinnata under sandy soils during the two seasons of 2021 and 2022
Table 8. Influence of biological substances on the dry and fresh weight (g) of D. pinnata flower under sandy soils during the two seasons of 2021 and 2022
Table 9. Influence of biological substances on the number of tuberous roots/plant and fresh weight of tuberous roots/plant (g) of D. pinnata under sandy soils during the two seasons of 2021 and 2022
Figure 1. Influence of biological substances on total carbohydrate content (mg/g D. W.) of D. pinnata under sandy soils during two seasons of 2022 and 2023.T1 = control, T2 = salicylic acid (SA) at rate of 300 mg/L., T3 = AA at rate of 300 mg/L, T4 = moringa leaf extract at rate of 10 g/l MLE, T5 = SA+AA, T6 = SA+MLE, T7 = AA+MLE and T8 = SA+AA+MLE.
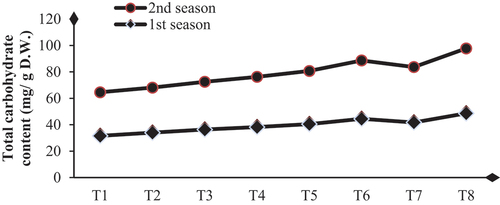
Figure 2. Influence of biological substances on total chlorophyll content (mg/g D. W.) of D. pinnata under sandy soils during two seasons of 2022 and 2023.T1=control, T2=salicylic acid (SA) at rate of 300 mg/L., T3= AA at a rate of 300 mg/L, T4=moringa leaf extract at rate of 10 g/l MLE, T5=SA+AA, T6=SA+MLE, T7=AA+MLE and T8= SA+AA+MLE.
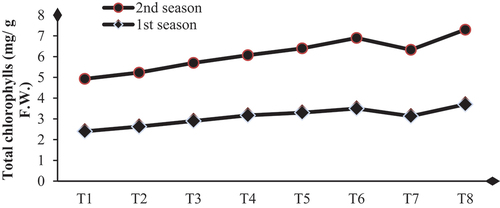
Figure 3. Influence of biological substances on nitrogen content (%) (mg/g D. W.) of D. pinnata under sandy soils during two seasons of 2022 and 2023. T1=control, T2=salicylic acid (SA) at rate of 300 mg/L., T3= AA at rate of 300 mg/L, T4=moringa leaf extract at rate of 10 g/l MLE, T5=SA+AA, T6=SA+MLE, T7=AA+MLE and T8= SA+AA+MLE.
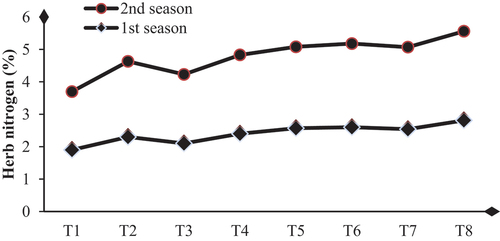
Figure 4. Influence of biological substances on phosphorus content (%) (mg/g D. W.) of D. pinnata under sandy soils during two seasons of 2022 and 2023. T1=control, T2=salicylic acid (SA) at a rate of 300 mg/L., T3= AA at a rate of 300 mg/L, T4=moringa leaf extract at a rate of 10 g/l MLE, T5=SA+AA, T6=SA+MLE, T7=AA+MLE and T8= SA+AA+MLE.
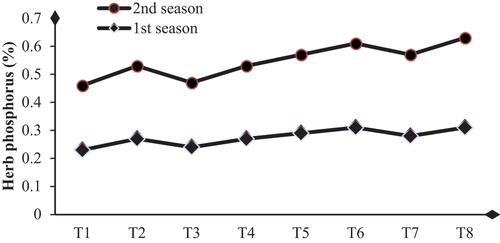
Figure 5. Influence of biological substances on potassium content (%) (mg/g D. W.) of D. pinnata under sandy soils during two seasons of 2022 and 2023. T1=control, T2=salicylic acid (SA) at a rate of 300 mg/L., T3= AA at a rate of 300 mg/L, T4=moringa leaf extract at a rate of 10 g/l MLE, T5=SA+AA, T6=SA+MLE, T7=AA+MLE and T8= SA+AA+MLE.
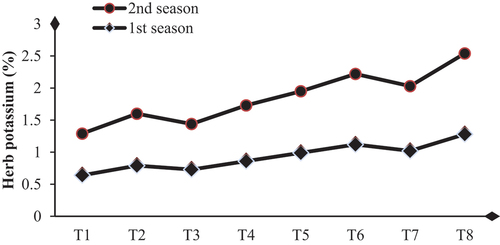
Table 10. Influence of biostimulants on total carbohydrate content (mg/g D.W.) and total chlorophylls (mg/g F.W.) of Dahlia pinnata under newly reclaimed soils during the two seasons of 2021 and 2022
Table 11. Influence of biostimulants on nitrogen, phosphorus, and potassium content (%) of Dahlia pinnata herb under newly reclaimed soils during the two seasons of 2021 and 2022
Data availability statement
All data generated or analyzed during this study are included in this published article.