
Figures & data
Figure 1. The study area map reveals the sites of specimen collection of the Ribb Reservoir, Ethiopia.
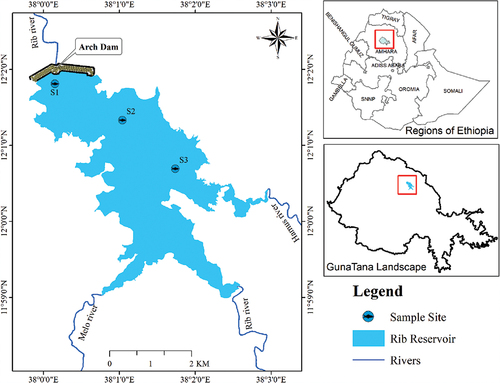
Figure 2. The percentage contribution of geometric index importance (%GIIi) in the diet of C. gariepinus (n = 379) from Ribb Reservoir.
Table 1. Proportions of different food items in the diet of C. gariepinus (n = 379) in Ribb Reservoir, Ethiopia
Figure 3. The size class variation in the diet of C. gariepinus in Ribb Reservoir, Ethiopia.
Figure 4. The relative importance of prey items (PIi% and GIIi%) with respect to size classes in the diet of C. gariepinus.
Table 2. Relative contribution percentage frequency of occurrence (%Qi), volumetric contribution (%Vi), index of preponderance (%PIi) and geometric index of importance (%GIIi) of different food items in the diet of Clarias gariepinus in Ribb Reservoir during the dry and wet seasons