Figures & data
Table 1. Plant materials used in the experiment
Figure 1. Maximum, minimum, and mean temperature along with 24h accumulated precipitation during the wheat growing season of 2021–22 (1a) and 2022–23 (1b).
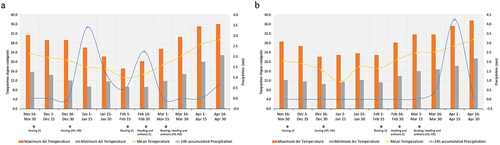
Table 2. Additive main effects and multiplicative interaction (AMMI) model analysis of variance (ANOVA) of quantitative traits studied
Table 3. Combined analysis of variance (ANOVA) showing percentage reduction in yield and yield attributing parameters of bread wheat under HS and HD environments
Figure 2. Boxplot showing mean performance and the impact of heat stress and heat drought environment on days to booting (DTB), days to heading (DTH) and days to anthesis (DTA) (2a); booting to heading duration BtoH), booting to anthesis duration (BtoA), heading to anthesis duration (BtoA) (2b); plant height (Ph) (2c); spike length (SL); number of spikes per spikelets (NSPS), 10 spike weight (TSW) (2d); number of spikes per meter square (2e); number grains per spike, thousand kernel weight (TKW) (2f); and grain yield (GY)(2g).
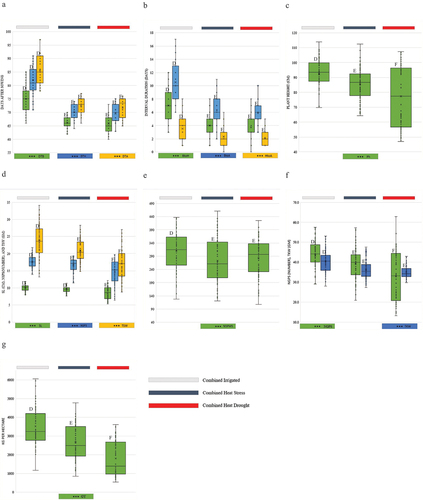
Table 4. Yield performance, percentage yield reduction, coefficient of variation (CV), and F-Value (df = 5) of elite wheat genotypes (df = 19) across tested environments (df = 5)
Figure 3. Combined phenotypic correlation across 14 quantitative traits of wheat genotypes under irrigated (3a), heat stress (3b), and heat drought (3c) environment.
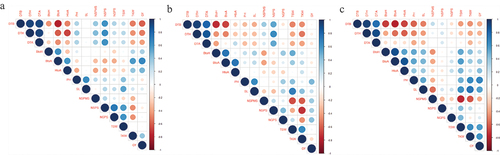
Table 5. Combined path analysis among 14 quantitative traits studied under irrigated, heat stress, and heat drought environment under two years
Table 6. Correlation among PC1-PC5 with yield and yield attributing parameters of bread wheat under irrigated, heat stress and heat drought environment
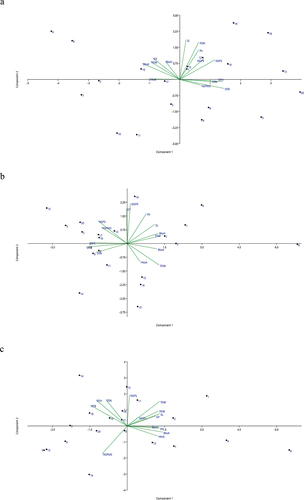
Figure 4. Combined principal component analysis (PCA) under irrigated (4a), heat stress (4b), and heat drought (4c) environment.