
Figures & data
Figure 1. Location map of study locations.
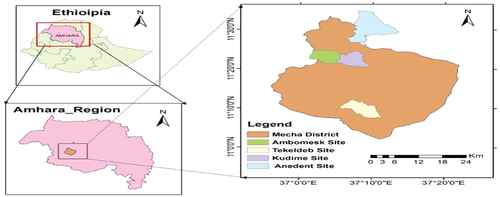
Figure 2. Mean monthly rainfall (RF), mean monthly maximum and minimum temperatures of the study area for two years from 2020–2022.
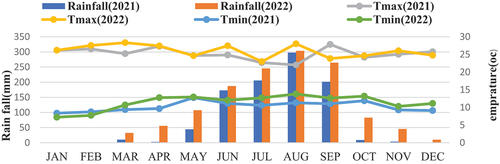
Table 1. The crop management scenarios for maize production explored in northwest Ethiopia midland
Table 2. Monthly climate data from 1987 to 2018
Table 3. The average of the physicochemical properties of soil at four research locations served as the input for the DSSAT-CERES-maize model
Table 4. Genetic coefficients for the DSSAT CERES-Maize model
Table 5. Generated genetic coefficients using experimental BH540 maize cultivars
Table 6. The model calibration performance for days to anthesis, days to maturity, leaf area index, biomass, and grain yield for the medium maize cultivar of the BH540 over across two locations in 2020 and 2021
Table 7. The model evaluation performance for days to anthesis, days to maturity, leaf area index, biomass, and grain yield for the medium maize cultivar of the BH540 across four locations in 2022
Figure 3. Comparison of the simulated and observed above-ground biomass (A), grain yield (B), and leaf area index (C) values for the BH540 cultivars in the calibration experiment.
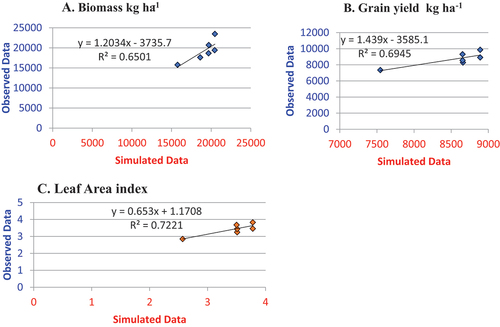
Figure 4. Comparison of the simulated and observed above-ground biomass (D), grain yield (E), and leaf area index (F) values for the BH540 cultivars in the evaluation experiment.
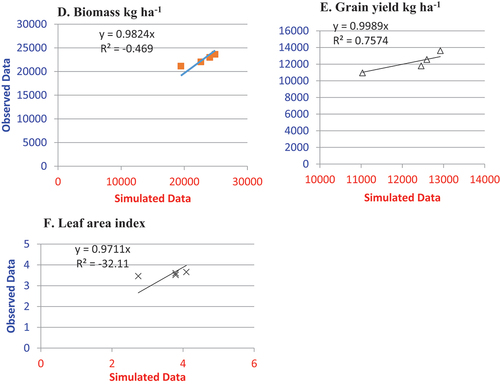
Figure 5. Observed and simulated of grain yield.
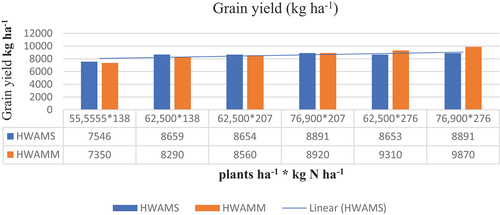
Figure 6. Observed and simulated of above ground biomass.
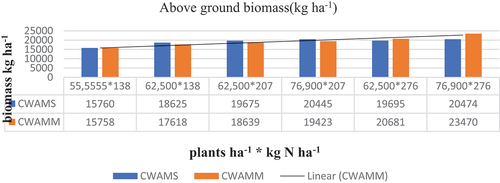
Figure 7. Observed and simulated of leaf area index.
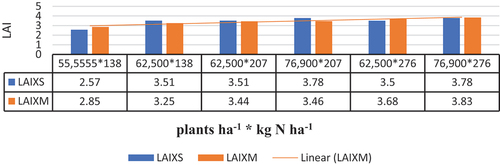
Table 8. Observed and simulated values of grain yield, above ground biomass, and leaf area index
Data availability statement
The data used to support the findings of this study are included in the results part of the manuscript