
Figures & data
Table 1. List of UV-B radiation intensities in natural light (10–11 a.m.).
Table 2. Primers used for the qRT–PCR assay.
Figure 1. Effect of enhanced UV-B radiation on dynamic changes in MDA content (a, b) and relative conductivity value of pulp (c, d).
Note: * indicates a significant difference at the level of p < 0.05. CK (control check) indicates the natural light control, T (UV-B treatment) indicates enhanced UV-B radiation treatment, and the same applies below.
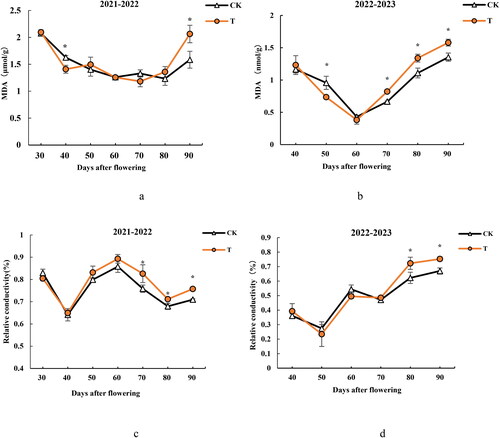
Figure 2. Effect of enhanced UV-B radiation on dynamic changes in superoxide anion (a, b) and H2O2 content (c, d).
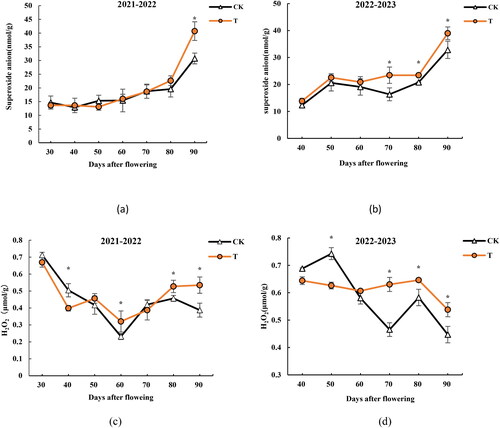
Figure 3. Effect of enhanced UV-B radiation on dynamic changes in total flavonoid (a, b) contents in pulp.
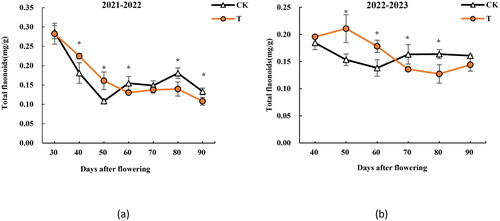
Figure 4. Bar plot of differentially expressed genes at 60 and 90 days after flowering (a) and KEGG enrichment analysis (b).
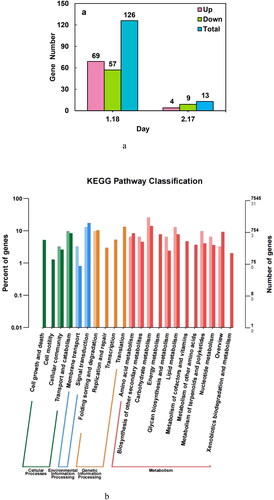
Figure 5. Correlation analysis between real-time PCR and transcriptome expression.
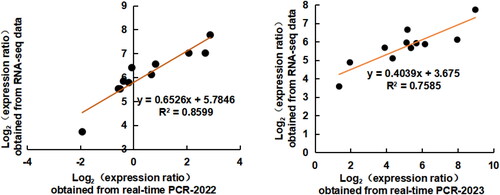
Table 3. Statistical table of the number of different metabolites (the former compared to the latter).


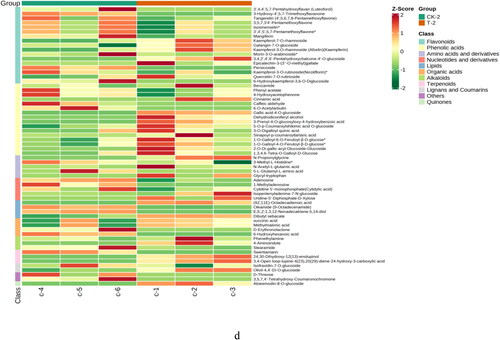
Figure 7. Integrative analysis of the metabolome and transcriptome of flavonoids and flavonoid compounds in mango pulp of the treatment and control groups.
Note: CS1, CS2, CS3 and TS1, TS2, TS3 represent natural light control and enhanced UV-B radiation treatment at 30, 60 and 90 days after flowering.

Data availability statement
All data generated or analysed during this study are included in this published article.