
Figures & data
Figure 1. Location of the study area.
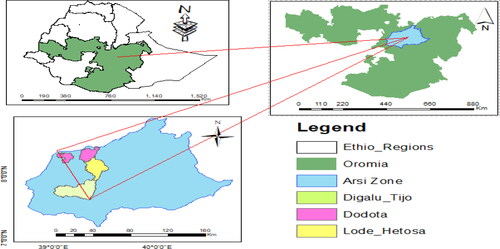
Table 1. Sample households distribution across districts and kebeles.
Table 2. The study’s variable definitions, measurements and hypotheses.
Table 3. Summary statistics of explanatory variables used in the study (N = 422).
Table 4. Summary statistics of independent variables used in the nutritional status (N = 422).
Figure 2. The study area’s households’ level of food security.
Source: Own computation based on survey data, 2022.
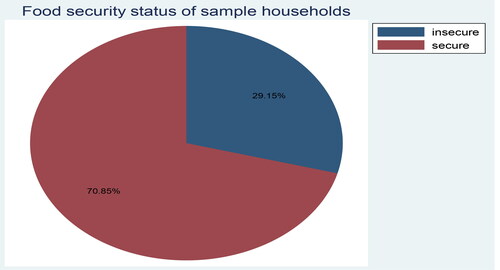
Table 5. Household level of nutritional status.
Table 6. Determinants of household level food security status.
Table 7. Determinants of household level nutritional status.
Supplemental material