Figures & data
Table 1. Variable definitions, measurement and working hypothesis.
Table 2. Sample households’ distribution by adoption intensity score group.
Table 3. Socio-economic characteristics of sample households by the intensity of adoption.
Table 4. Socioeconomic characteristics of sample households by adoption intensity.
Table 5. The estimated value of the generalized propensity score distribution.
Figure 1. GPS-score Kernel density with common support regions.
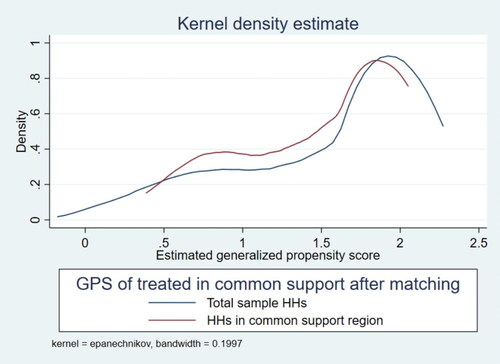
Table 6. Balancing: test for covariate means equalityFootnote3.
Table 7. Consumption spending, per capita income, and daily calorie intake per AE for households are approximated using the dose-response function.
Figure 2. Adoption intensity on daily calorie intake dose-response and treatment effect.
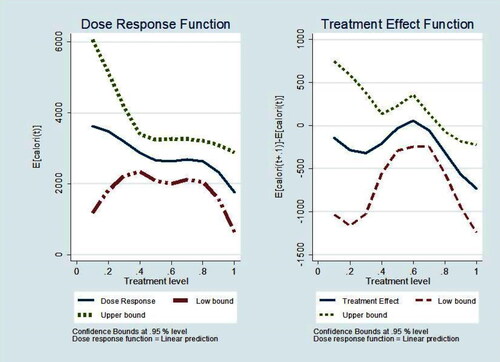
Figure 3. Adoption intensity on consumption expenditure dose-response and treatment effect.
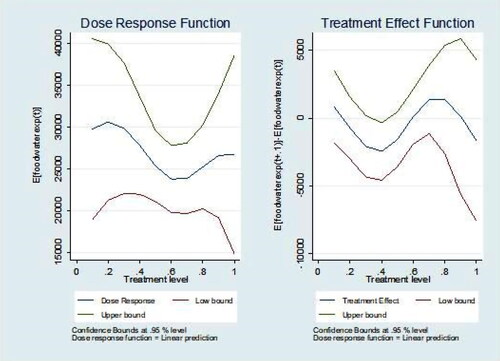
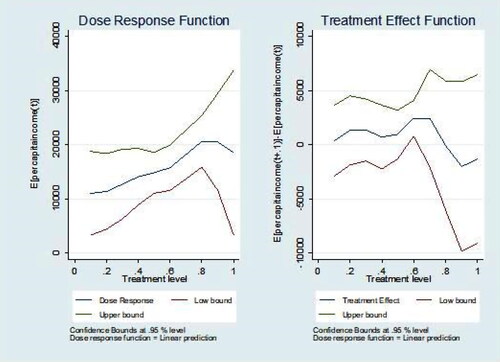
Figure 4. Adoption intensity on per capita income dose-response and treatment effect.