
Figures & data
Figure 1. Location map of the study area.
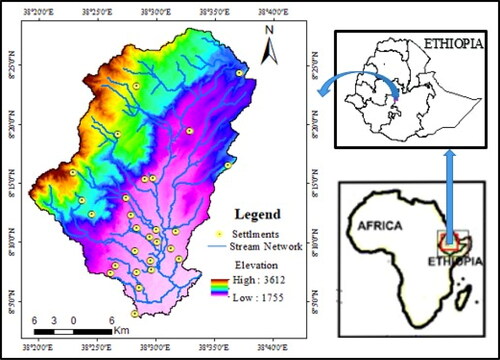
Figure 2. Dimensional terrain distributions (Source, Ethiopian water technology center, 2008).
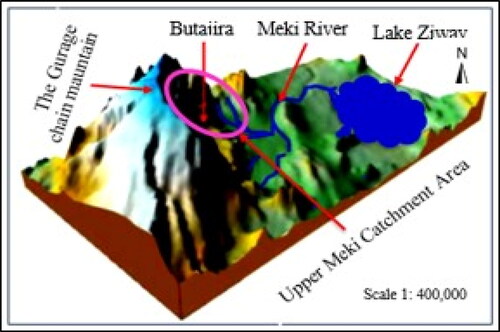
Figure 3. Rain fall Stations (A) and their influencing area (B).
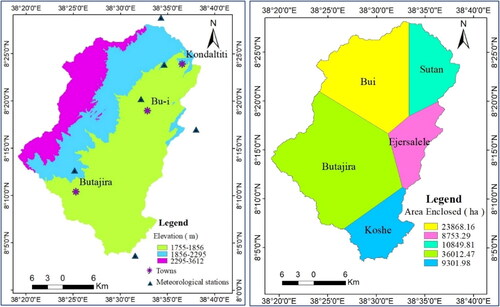
Table 1. Satellite imageries data.
Figure 4. Land use and Land cover units (A) and Average Normalized Difference Vegetation Index (B) (NDVI) for upper Meki sub catchment.
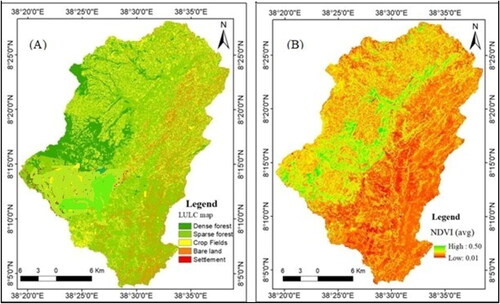
Figure 5. General work flow for the study.
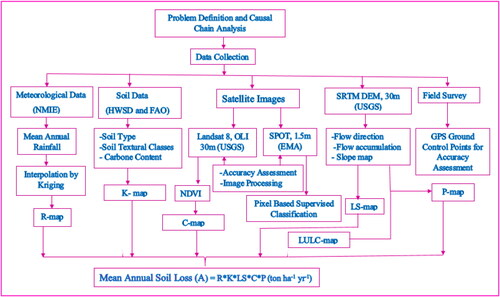
Table 2. Area of land use type.
Figure 6. Rain fall erosivity factor (R) (A), Soil erodibility factor (K) (B), Topographic factor (LS) (C), Cropping management factor (C,D).
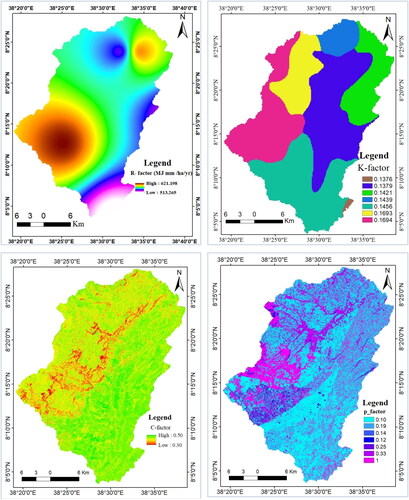
Figure 7. Support practices factor (P) (A), Stream power index (SPI) (B), Potential soil loss (C), Actual soil loss (D).
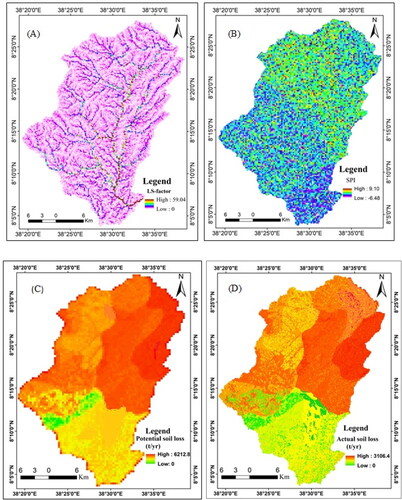
Table 3. R-values in the upper Meki catchment.
Table 4. Soil types and the K-factors for upper Meki catchment.
Table 5. Area of various degrees of slope categories in upper Meki catchment.
Table 6. LS factor in the upper Meki catchment.
Table 7. The support practice (P) values of the studied catchment area.
Data availability statement
The data that support the findings of this study are available from the corresponding author upon reasonable request. Author address can be found from the abstract page.